Estimated Value: $315,000 - $375,000
4
Beds
1
Bath
1,440
Sq Ft
$243/Sq Ft
Est. Value
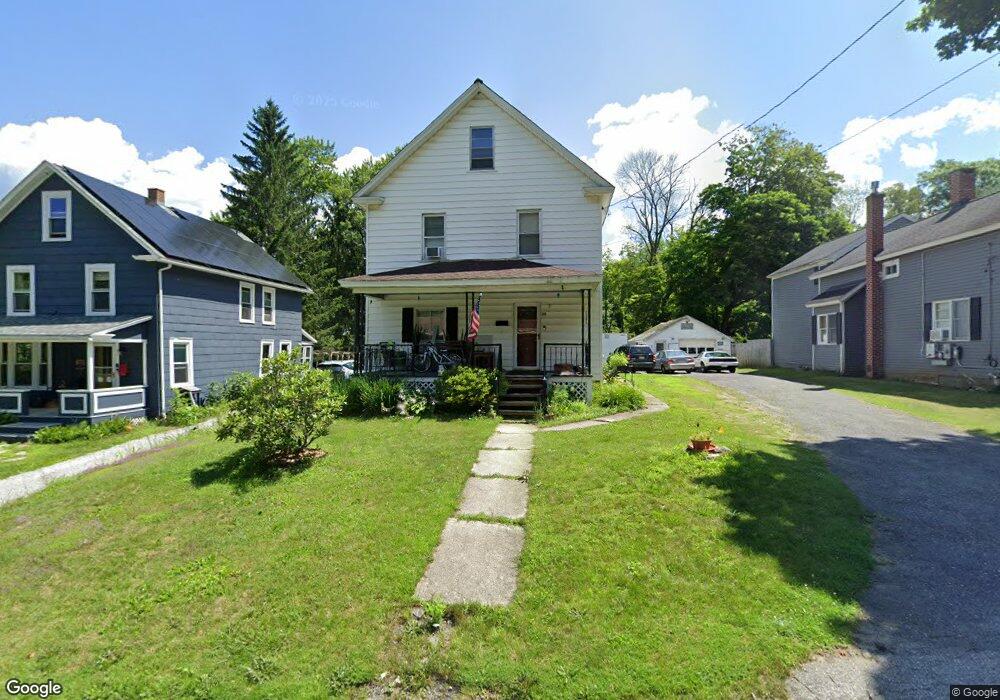
About This Home
This home is located at 23 Robert St, Lee, MA 01238 and is currently estimated at $349,476, approximately $242 per square foot. 23 Robert St is a home located in Berkshire County with nearby schools including Lee Elementary School, Lee Middle/High School, and St. Mary's School.
Ownership History
Date
Name
Owned For
Owner Type
Purchase Details
Closed on
Jul 11, 2023
Sold by
Beckman Ernest A
Bought by
Beckman Lynn M
Current Estimated Value
Purchase Details
Closed on
Dec 13, 2021
Sold by
Beckman Ernest A
Bought by
Beckman Lynn M
Home Financials for this Owner
Home Financials are based on the most recent Mortgage that was taken out on this home.
Original Mortgage
$125,000
Interest Rate
3.09%
Mortgage Type
New Conventional
Purchase Details
Closed on
Apr 4, 2006
Sold by
Lipford Barbara J and Lipford Lewis
Bought by
Beckman Ernest A and Beckman Lynn M
Home Financials for this Owner
Home Financials are based on the most recent Mortgage that was taken out on this home.
Original Mortgage
$152,540
Interest Rate
6.32%
Mortgage Type
Purchase Money Mortgage
Create a Home Valuation Report for This Property
The Home Valuation Report is an in-depth analysis detailing your home's value as well as a comparison with similar homes in the area
Home Values in the Area
Average Home Value in this Area
Purchase History
| Date | Buyer | Sale Price | Title Company |
|---|---|---|---|
| Beckman Lynn M | -- | None Available | |
| Beckman Lynn M | -- | None Available | |
| Beckman Lynn M | -- | None Available | |
| Beckman Lynn M | -- | None Available | |
| Beckman Ernest A | $190,675 | -- | |
| Beckman Ernest A | $190,675 | -- |
Source: Public Records
Mortgage History
| Date | Status | Borrower | Loan Amount |
|---|---|---|---|
| Previous Owner | Beckman Lynn M | $125,000 | |
| Previous Owner | Beckman Ernest A | $152,540 |
Source: Public Records
Tax History
| Year | Tax Paid | Tax Assessment Tax Assessment Total Assessment is a certain percentage of the fair market value that is determined by local assessors to be the total taxable value of land and additions on the property. | Land | Improvement |
|---|---|---|---|---|
| 2025 | $3,120 | $277,300 | $85,900 | $191,400 |
| 2024 | $3,263 | $290,300 | $84,100 | $206,200 |
| 2023 | $3,123 | $264,000 | $80,100 | $183,900 |
| 2022 | $3,310 | $242,500 | $105,900 | $136,600 |
| 2021 | $3,272 | $222,900 | $95,200 | $127,700 |
| 2020 | $3,033 | $206,600 | $89,000 | $117,600 |
| 2019 | $3,133 | $212,000 | $91,200 | $120,800 |
| 2018 | $3,085 | $210,900 | $91,200 | $119,700 |
| 2017 | $2,948 | $200,300 | $77,900 | $122,400 |
| 2016 | $2,883 | $198,000 | $75,600 | $122,400 |
| 2015 | $2,788 | $198,000 | $75,600 | $122,400 |
| 2014 | $2,772 | $195,900 | $75,600 | $120,300 |
Source: Public Records
Map
Nearby Homes
- 180 Center St
- 205 High St
- 131 Center St
- 30 Pease Terrace
- 290 E Center St
- 0 East St Unit 235893
- 155 Laurel St
- 135 East St
- 140 Theresa Terrace
- 155 Water St Unit 5
- 2 Devon Rd
- 615 Laurel St
- 184 Washington Mountain Rd
- 45 Forest St
- 528 Walker St
- 524 Walker St
- 500 Walker St
- 735 Cape St
- 2 Saint Andrews Ct
- 770 Summer St Unit 5D
Your Personal Tour Guide
Ask me questions while you tour the home.