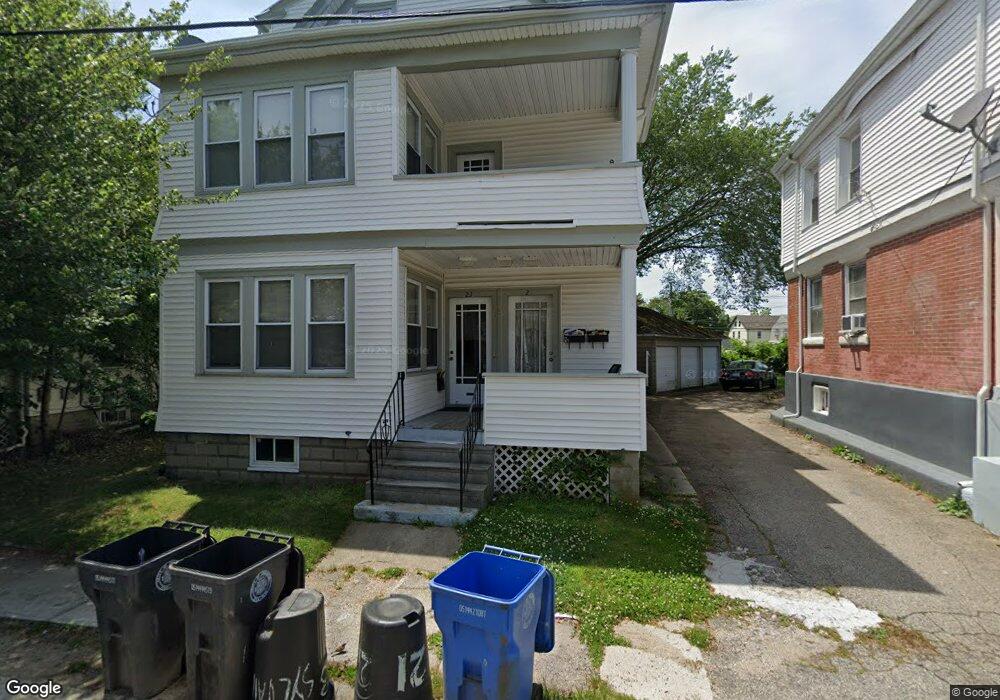
23 Sylvan Ave Cranston, RI 02905
Edgewood NeighborhoodEstimated Value: $560,636 - $749,000
6
Beds
3
Baths
3,266
Sq Ft
$202/Sq Ft
Est. Value
About This Home
This home is located at 23 Sylvan Ave, Cranston, RI 02905 and is currently estimated at $660,659, approximately $202 per square foot. 23 Sylvan Ave is a home located in Providence County with nearby schools including Edward S. Rhodes School, Park View Middle School, and Cranston High School East.
Ownership History
Date
Name
Owned For
Owner Type
Purchase Details
Closed on
Dec 11, 2009
Sold by
Cruickshank Robert F and Gannutz Michael F
Bought by
Deutsche Bank Natl T C
Current Estimated Value
Purchase Details
Closed on
Sep 25, 2003
Sold by
Scott Georgia
Bought by
Cruickshank Robert and Gannutz Michael
Home Financials for this Owner
Home Financials are based on the most recent Mortgage that was taken out on this home.
Original Mortgage
$206,400
Interest Rate
6.29%
Create a Home Valuation Report for This Property
The Home Valuation Report is an in-depth analysis detailing your home's value as well as a comparison with similar homes in the area
Home Values in the Area
Average Home Value in this Area
Purchase History
| Date | Buyer | Sale Price | Title Company |
|---|---|---|---|
| Deutsche Bank Natl T C | $149,000 | -- | |
| Cruickshank Robert | $258,000 | -- |
Source: Public Records
Mortgage History
| Date | Status | Borrower | Loan Amount |
|---|---|---|---|
| Previous Owner | Cruickshank Robert | $206,400 | |
| Previous Owner | Cruickshank Robert | $38,700 |
Source: Public Records
Tax History
| Year | Tax Paid | Tax Assessment Tax Assessment Total Assessment is a certain percentage of the fair market value that is determined by local assessors to be the total taxable value of land and additions on the property. | Land | Improvement |
|---|---|---|---|---|
| 2025 | $7,023 | $506,000 | $99,400 | $406,600 |
| 2024 | $6,887 | $506,000 | $99,400 | $406,600 |
| 2023 | $6,195 | $327,800 | $65,500 | $262,300 |
| 2022 | $6,068 | $327,800 | $65,500 | $262,300 |
| 2021 | $5,900 | $327,800 | $65,500 | $262,300 |
| 2020 | $5,762 | $277,400 | $62,300 | $215,100 |
| 2019 | $5,762 | $277,400 | $62,300 | $215,100 |
| 2018 | $5,628 | $277,400 | $62,300 | $215,100 |
| 2017 | $4,905 | $213,800 | $56,100 | $157,700 |
| 2016 | $4,800 | $213,800 | $56,100 | $157,700 |
| 2015 | $4,800 | $213,800 | $56,100 | $157,700 |
| 2014 | $4,132 | $180,900 | $56,100 | $124,800 |
Source: Public Records
Map
Nearby Homes
- 10 Sylvan Ave
- 27 Cliffdale Ave
- 29 Malvern Ave
- 42 Netherlands Ave
- 73 Moorland Ave
- 78 Villa Ave
- 68 Ferncrest Ave
- 73 Western Promenade
- 63 Taft St
- 19 Warwick Ave
- 172 Bluff Ave
- 126 Columbia Ave
- 94 Holmes Rd
- 115 Irving Rd
- 147 Wentworth Ave
- 27 Vickery St
- 1180 Narragansett Blvd Unit 1
- 210 Irving Rd
- 166 Narragansett St
- 390 Montgomery Ave
Your Personal Tour Guide
Ask me questions while you tour the home.