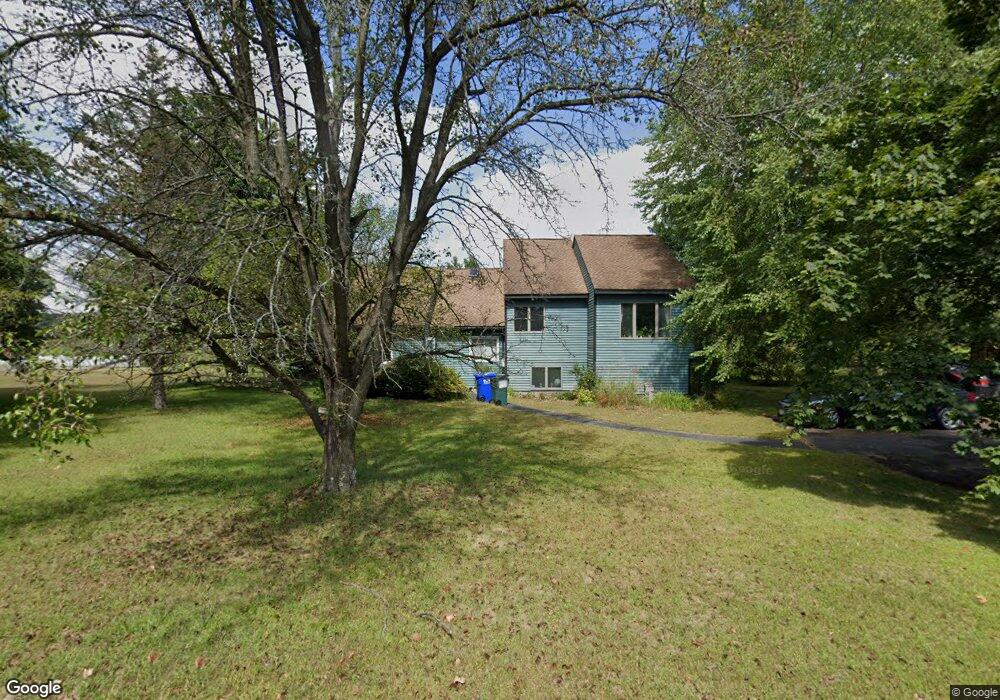
23 Tamarack Dr Amherst, MA 01002
Estimated Value: $265,000 - $358,000
3
Beds
3
Baths
960
Sq Ft
$333/Sq Ft
Est. Value
About This Home
This home is located at 23 Tamarack Dr, Amherst, MA 01002 and is currently estimated at $320,056, approximately $333 per square foot. 23 Tamarack Dr is a home located in Hampshire County with nearby schools including Fort River Elementary School, Amherst Regional Middle School, and Amherst Regional High School.
Ownership History
Date
Name
Owned For
Owner Type
Purchase Details
Closed on
Nov 18, 2024
Sold by
23 Tamarack Dr Llc
Bought by
Ross Sheldon T and Peters-Ross Diana R
Current Estimated Value
Purchase Details
Closed on
Dec 9, 2022
Sold by
Peters-Ross Diana R and Ross Sheldon T
Bought by
23 Tamarack Drive Llc
Purchase Details
Closed on
Jan 26, 2004
Sold by
Peters Diana R
Bought by
Peters-Ross Diana R and Ross Sheldon T
Purchase Details
Closed on
Jun 28, 2000
Sold by
Nguyen Heip and Nguyen Hung
Bought by
Peters Diana R
Home Financials for this Owner
Home Financials are based on the most recent Mortgage that was taken out on this home.
Original Mortgage
$75,000
Interest Rate
8.59%
Mortgage Type
Purchase Money Mortgage
Create a Home Valuation Report for This Property
The Home Valuation Report is an in-depth analysis detailing your home's value as well as a comparison with similar homes in the area
Home Values in the Area
Average Home Value in this Area
Purchase History
| Date | Buyer | Sale Price | Title Company |
|---|---|---|---|
| Ross Sheldon T | -- | None Available | |
| Ross Sheldon T | -- | None Available | |
| 23 Tamarack Drive Llc | -- | None Available | |
| 23 Tamarack Drive Llc | -- | None Available | |
| Peters-Ross Diana R | -- | -- | |
| Peters-Ross Diana R | -- | -- | |
| Peters Diana R | $129,000 | -- | |
| Peters Diana R | $129,000 | -- |
Source: Public Records
Mortgage History
| Date | Status | Borrower | Loan Amount |
|---|---|---|---|
| Previous Owner | Peters Diana R | $74,800 | |
| Previous Owner | Peters Diana R | $75,000 |
Source: Public Records
Tax History Compared to Growth
Tax History
| Year | Tax Paid | Tax Assessment Tax Assessment Total Assessment is a certain percentage of the fair market value that is determined by local assessors to be the total taxable value of land and additions on the property. | Land | Improvement |
|---|---|---|---|---|
| 2025 | $61 | $342,500 | $0 | $342,500 |
| 2024 | $5,975 | $322,800 | $0 | $322,800 |
| 2023 | $5,548 | $276,000 | $0 | $276,000 |
| 2022 | $4,448 | $209,100 | $0 | $209,100 |
| 2021 | $4,244 | $194,500 | $0 | $194,500 |
| 2020 | $4,147 | $194,500 | $0 | $194,500 |
| 2019 | $3,961 | $181,700 | $0 | $181,700 |
| 2018 | $3,841 | $181,700 | $0 | $181,700 |
| 2017 | $3,543 | $162,300 | $0 | $162,300 |
| 2016 | $3,444 | $162,300 | $0 | $162,300 |
| 2015 | $3,334 | $162,300 | $0 | $162,300 |
Source: Public Records
Map
Nearby Homes
- 12 Chadwick Ct
- 53 Pine Grove Unit 53
- 785 Main St
- 57 Tanglewood Rd
- 14 Pebble Ridge Rd
- 74 N Whitney St
- 148 Wildflower Dr
- 11 Dayton Ln
- 6 Evening Star Dr
- 61 S Valley Rd
- 17 Palley Village Place
- 63 Larkspur Dr
- 0 Red Gate Ln Unit 73348273
- 60 Red Gate Ln
- 18 N Prospect St
- 967 S East St
- 24 S Sunset Ave
- 305 Strong St
- 0 S Sunset Ave
- 130 Linden Ridge Rd