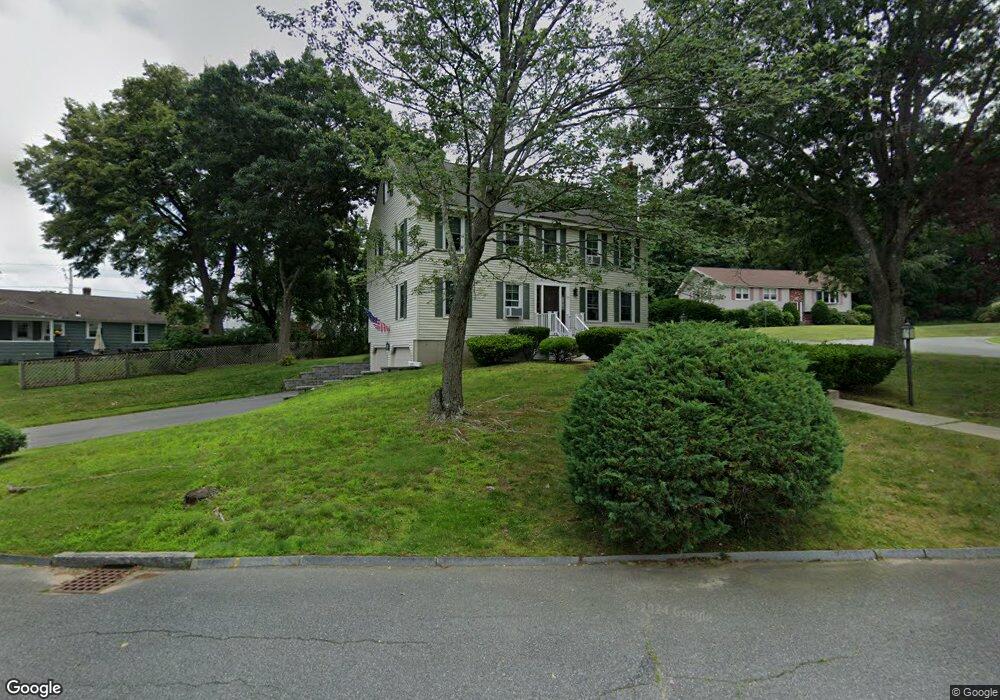
23 Tanglewood Cir Methuen, MA 01844
The East End NeighborhoodEstimated Value: $621,000 - $719,000
4
Beds
3
Baths
2,072
Sq Ft
$327/Sq Ft
Est. Value
About This Home
This home is located at 23 Tanglewood Cir, Methuen, MA 01844 and is currently estimated at $677,231, approximately $326 per square foot. 23 Tanglewood Cir is a home located in Essex County with nearby schools including Timony Grammar School, Methuen High School, and Saint Monica School.
Ownership History
Date
Name
Owned For
Owner Type
Purchase Details
Closed on
Sep 1, 1998
Sold by
Collins Sean M
Bought by
Manning Paul L
Current Estimated Value
Home Financials for this Owner
Home Financials are based on the most recent Mortgage that was taken out on this home.
Original Mortgage
$164,000
Outstanding Balance
$35,033
Interest Rate
6.9%
Mortgage Type
Purchase Money Mortgage
Estimated Equity
$642,198
Purchase Details
Closed on
Dec 19, 1995
Sold by
Collins Joseph F
Bought by
Collins Sean M
Create a Home Valuation Report for This Property
The Home Valuation Report is an in-depth analysis detailing your home's value as well as a comparison with similar homes in the area
Home Values in the Area
Average Home Value in this Area
Purchase History
| Date | Buyer | Sale Price | Title Company |
|---|---|---|---|
| Manning Paul L | $205,000 | -- | |
| Manning Paul L | $205,000 | -- | |
| Collins Sean M | $184,500 | -- | |
| Collins Sean M | $184,500 | -- |
Source: Public Records
Mortgage History
| Date | Status | Borrower | Loan Amount |
|---|---|---|---|
| Open | Collins Sean M | $164,000 | |
| Closed | Collins Sean M | $164,000 |
Source: Public Records
Tax History
| Year | Tax Paid | Tax Assessment Tax Assessment Total Assessment is a certain percentage of the fair market value that is determined by local assessors to be the total taxable value of land and additions on the property. | Land | Improvement |
|---|---|---|---|---|
| 2025 | $6,598 | $623,600 | $231,000 | $392,600 |
| 2024 | $6,542 | $602,400 | $210,000 | $392,400 |
| 2023 | $6,277 | $536,500 | $187,500 | $349,000 |
| 2022 | $5,876 | $450,300 | $150,000 | $300,300 |
| 2021 | $5,532 | $419,400 | $142,500 | $276,900 |
| 2020 | $5,479 | $407,700 | $142,500 | $265,200 |
| 2019 | $5,378 | $379,000 | $135,000 | $244,000 |
| 2018 | $5,239 | $367,100 | $135,000 | $232,100 |
| 2017 | $5,086 | $347,200 | $135,000 | $212,200 |
| 2016 | $5,083 | $343,200 | $135,000 | $208,200 |
| 2015 | $4,846 | $331,900 | $135,000 | $196,900 |
Source: Public Records
Map
Nearby Homes
- 593 Prospect St
- 611 Prospect St
- 37 Albion St
- 173 Jackson St
- 687 Jackson St
- 65 Arthur St
- 25-27 Bicknell Ave
- 97 Kenwood Rd
- 396 Oak St
- 12 Annette St
- 68 Ashford St
- 14 Court St
- Lot 108 Garden City Rd
- 7 Erhardt Terrace
- 39 Swan Ave
- 30 Anderson Dr
- 18 Erhardt Terrace
- 128 Pleasant Valley St
- 64-66 Howe St
- 129-131 Lexington St
Your Personal Tour Guide
Ask me questions while you tour the home.