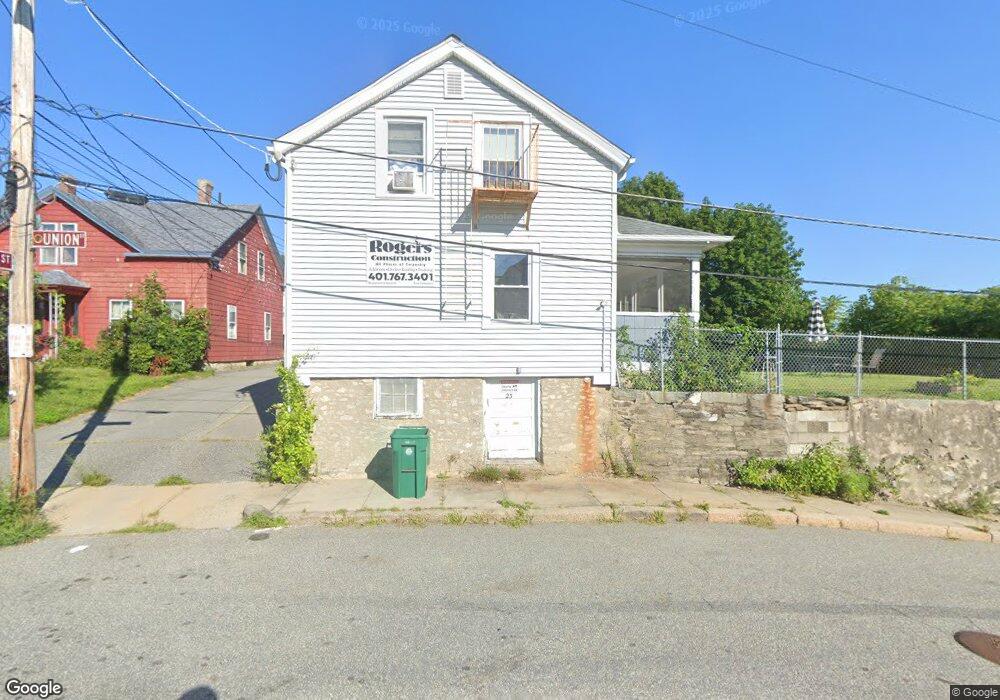
23 Union St Woonsocket, RI 02895
Bernon District NeighborhoodEstimated Value: $321,000 - $400,000
4
Beds
2
Baths
1,608
Sq Ft
$221/Sq Ft
Est. Value
About This Home
This home is located at 23 Union St, Woonsocket, RI 02895 and is currently estimated at $356,045, approximately $221 per square foot. 23 Union St is a home located in Providence County with nearby schools including Woonsocket High School, Founders Academy, and Beacon Charter School.
Ownership History
Date
Name
Owned For
Owner Type
Purchase Details
Closed on
Apr 15, 2016
Sold by
Rogers Michael and Lane Lois M
Bought by
Rogers Michael
Current Estimated Value
Purchase Details
Closed on
Oct 3, 2008
Sold by
Masterson Richard W
Bought by
Lane Lois M and Lane Bradford S
Home Financials for this Owner
Home Financials are based on the most recent Mortgage that was taken out on this home.
Original Mortgage
$70,000
Interest Rate
6.54%
Mortgage Type
Purchase Money Mortgage
Purchase Details
Closed on
Jan 17, 2003
Sold by
Lambert Douglas F
Bought by
Masterson Richard W
Purchase Details
Closed on
Apr 25, 1995
Sold by
Racine Yvette M
Bought by
Lambert John G and Lambert Douglas F
Create a Home Valuation Report for This Property
The Home Valuation Report is an in-depth analysis detailing your home's value as well as a comparison with similar homes in the area
Home Values in the Area
Average Home Value in this Area
Purchase History
| Date | Buyer | Sale Price | Title Company |
|---|---|---|---|
| Rogers Michael | -- | -- | |
| Lane Lois M | $100,000 | -- | |
| Masterson Richard W | $121,500 | -- | |
| Lambert John G | $87,500 | -- | |
| Rogers Michael | -- | -- | |
| Lane Lois M | $100,000 | -- | |
| Masterson Richard W | $121,500 | -- | |
| Lambert John G | $87,500 | -- |
Source: Public Records
Mortgage History
| Date | Status | Borrower | Loan Amount |
|---|---|---|---|
| Previous Owner | Lambert John G | $70,000 |
Source: Public Records
Tax History
| Year | Tax Paid | Tax Assessment Tax Assessment Total Assessment is a certain percentage of the fair market value that is determined by local assessors to be the total taxable value of land and additions on the property. | Land | Improvement |
|---|---|---|---|---|
| 2025 | $3,594 | $320,000 | $89,800 | $230,200 |
| 2024 | $3,648 | $250,900 | $91,400 | $159,500 |
| 2023 | $3,508 | $250,900 | $91,400 | $159,500 |
| 2022 | $3,508 | $250,900 | $91,400 | $159,500 |
| 2021 | $3,263 | $137,400 | $37,300 | $100,100 |
| 2020 | $3,298 | $137,400 | $37,300 | $100,100 |
| 2018 | $3,309 | $137,400 | $37,300 | $100,100 |
| 2017 | $3,672 | $122,000 | $40,800 | $81,200 |
| 2016 | $3,884 | $122,000 | $40,800 | $81,200 |
| 2015 | $4,463 | $122,000 | $40,800 | $81,200 |
| 2014 | $4,234 | $117,800 | $44,900 | $72,900 |
Source: Public Records
Map
Nearby Homes
- 379 Front St
- 233 Grove St
- 99 Allen St Unit 205
- 35 Greene St
- 24 Paradis Ave
- 180 Allen St Unit 104
- 15 Knight St
- 219 Crawford St
- 122 Grand St
- 74 Maple St
- 479 Logee St
- 120 East St
- 42 Transit St
- 115 Railroad St
- 99 Cato St
- 345 Carrington Ave
- 346 Carrington Ave
- 0 Irving Lot 192 Ave Unit 1383138
- 0 N Main St Unit 1401765
- 404 Carrington Ave
Your Personal Tour Guide
Ask me questions while you tour the home.