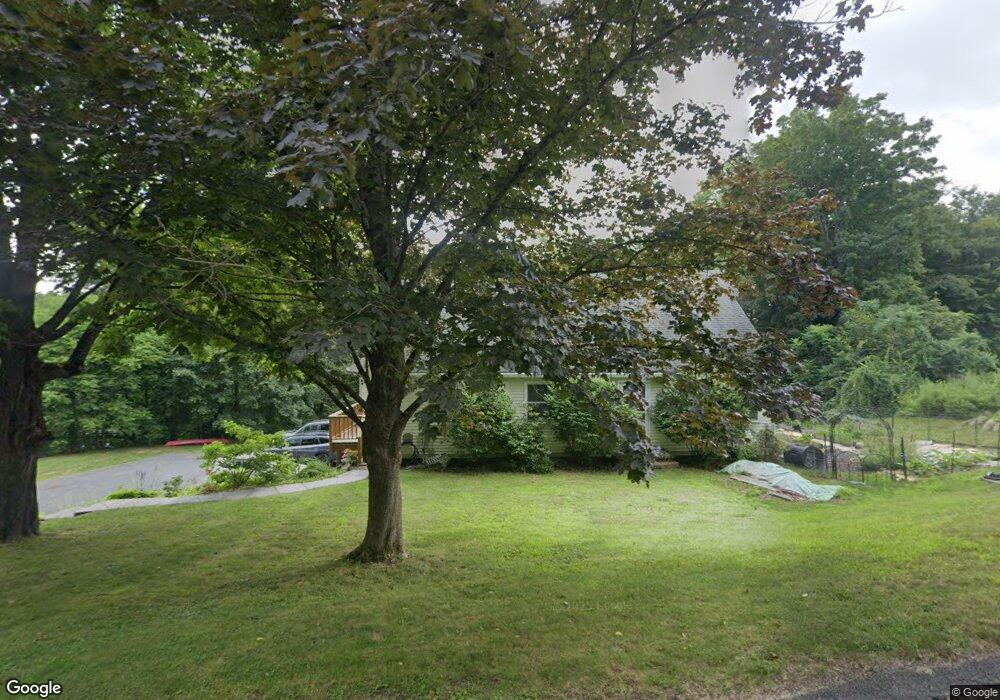
23 Walker Rd Shelburne Falls, MA 01370
Buckland NeighborhoodEstimated Value: $441,236 - $576,000
4
Beds
2
Baths
2,456
Sq Ft
$214/Sq Ft
Est. Value
About This Home
This home is located at 23 Walker Rd, Shelburne Falls, MA 01370 and is currently estimated at $526,059, approximately $214 per square foot. 23 Walker Rd is a home with nearby schools including Mohawk Trail Regional High School.
Ownership History
Date
Name
Owned For
Owner Type
Purchase Details
Closed on
Jun 15, 1993
Sold by
Wickline Beverly J
Bought by
Senior David J and Termo Cheryl S
Current Estimated Value
Home Financials for this Owner
Home Financials are based on the most recent Mortgage that was taken out on this home.
Original Mortgage
$101,200
Interest Rate
7.41%
Mortgage Type
Purchase Money Mortgage
Create a Home Valuation Report for This Property
The Home Valuation Report is an in-depth analysis detailing your home's value as well as a comparison with similar homes in the area
Home Values in the Area
Average Home Value in this Area
Purchase History
| Date | Buyer | Sale Price | Title Company |
|---|---|---|---|
| Senior David J | $126,500 | -- |
Source: Public Records
Mortgage History
| Date | Status | Borrower | Loan Amount |
|---|---|---|---|
| Closed | Senior David J | $152,300 | |
| Closed | Senior David J | $89,000 | |
| Closed | Senior David J | $101,200 |
Source: Public Records
Tax History
| Year | Tax Paid | Tax Assessment Tax Assessment Total Assessment is a certain percentage of the fair market value that is determined by local assessors to be the total taxable value of land and additions on the property. | Land | Improvement |
|---|---|---|---|---|
| 2025 | $5,882 | $347,200 | $58,600 | $288,600 |
| 2024 | $5,760 | $328,000 | $58,600 | $269,400 |
| 2023 | $5,067 | $299,100 | $58,600 | $240,500 |
| 2022 | $5,019 | $299,100 | $58,600 | $240,500 |
| 2021 | $4,760 | $266,800 | $58,600 | $208,200 |
| 2020 | $4,637 | $250,400 | $58,600 | $191,800 |
| 2019 | $4,413 | $236,900 | $58,600 | $178,300 |
| 2018 | $4,124 | $218,800 | $58,600 | $160,200 |
| 2017 | $3,949 | $218,800 | $58,600 | $160,200 |
| 2016 | $3,725 | $220,400 | $58,600 | $161,800 |
| 2015 | $3,703 | $220,400 | $58,600 | $161,800 |
Source: Public Records
Map
Nearby Homes
- 13 Bray Rd
- 10 Deerfield Ave Unit 2
- 102 Elm St
- 2151 Route 2
- 2155 Massachusetts 2
- 143 E Buckland Rd
- 7 Hog Hollow Rd
- 0 Upper St
- 31 W Oxbow Rd
- 24 W Oxbow Rd
- 0 W Oxbow Rd Unit 73453651
- 0 W Oxbow Rd Unit 248444
- 5 Clesson Brook Rd
- 1451 Massachusetts 2
- 1451 Route 2 E
- 85 Dacey Rd
- lot 1 Shelburne Falls Rd
- 240 Beldingville Rd
- 527 Main St
- 8 Deer Run Path
Your Personal Tour Guide
Ask me questions while you tour the home.