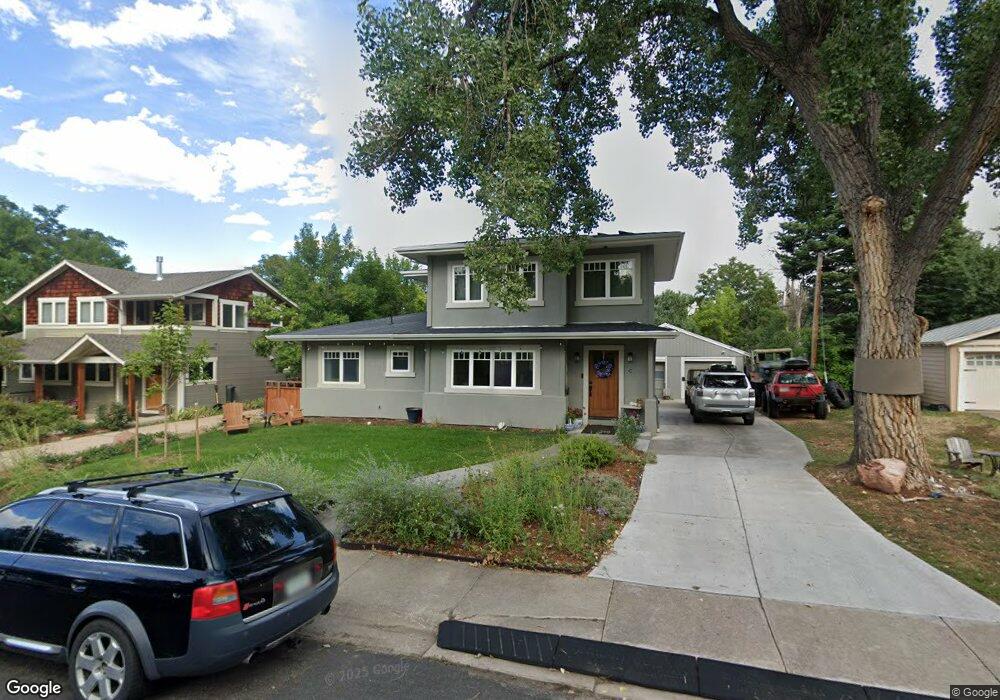
230 30th St Boulder, CO 80305
South Boulder NeighborhoodEstimated Value: $1,158,000 - $1,426,151
4
Beds
3
Baths
2,291
Sq Ft
$565/Sq Ft
Est. Value
About This Home
This home is located at 230 30th St, Boulder, CO 80305 and is currently estimated at $1,294,788, approximately $565 per square foot. 230 30th St is a home located in Boulder County with nearby schools including Creekside Elementary School, Manhattan Middle School of the Arts & Academics, and Fairview High School.
Ownership History
Date
Name
Owned For
Owner Type
Purchase Details
Closed on
Aug 9, 2010
Sold by
Walsh William J and Leftin Phillis T
Bought by
Ternes Robert John
Current Estimated Value
Home Financials for this Owner
Home Financials are based on the most recent Mortgage that was taken out on this home.
Original Mortgage
$256,800
Outstanding Balance
$171,053
Interest Rate
4.69%
Mortgage Type
New Conventional
Estimated Equity
$1,123,735
Purchase Details
Closed on
Feb 28, 1994
Sold by
Lichti Mark E and Lichti Lucinda J
Bought by
Guyer Jacob Andy
Home Financials for this Owner
Home Financials are based on the most recent Mortgage that was taken out on this home.
Original Mortgage
$118,400
Interest Rate
7%
Purchase Details
Closed on
Dec 5, 1984
Bought by
Ternes Robert John and Lindsay Jane
Create a Home Valuation Report for This Property
The Home Valuation Report is an in-depth analysis detailing your home's value as well as a comparison with similar homes in the area
Home Values in the Area
Average Home Value in this Area
Purchase History
We collect this data history from publicly available records. To have your information removed, we recommend requesting removal directly through your county’s website.
| Date | Buyer | Sale Price | Title Company |
|---|---|---|---|
| Ternes Robert John | $321,000 | Fidelity National Title Insu | |
| Guyer Jacob Andy | $148,000 | -- | |
| Ternes Robert John | -- | -- |
Source: Public Records
Mortgage History
We collect this data history from publicly available records. To have your information removed, we recommend requesting removal directly through your county’s website.
| Date | Status | Borrower | Loan Amount |
|---|---|---|---|
| Open | Ternes Robert John | $256,800 | |
| Previous Owner | Guyer Jacob Andy | $118,400 |
Source: Public Records
Tax History
| Year | Tax Paid | Tax Assessment Tax Assessment Total Assessment is a certain percentage of the fair market value that is determined by local assessors to be the total taxable value of land and additions on the property. | Land | Improvement |
|---|---|---|---|---|
| 2025 | $7,831 | $89,352 | $39,345 | $50,007 |
| 2024 | $7,948 | $82,126 | $36,163 | $45,963 |
| 2023 | $7,810 | $90,437 | $42,538 | $51,583 |
| 2022 | $6,898 | $74,281 | $32,213 | $42,068 |
| 2021 | $6,578 | $76,419 | $33,140 | $43,279 |
| 2020 | $5,857 | $67,289 | $31,961 | $35,328 |
| 2019 | $5,768 | $67,289 | $31,961 | $35,328 |
| 2018 | $5,283 | $60,934 | $29,448 | $31,486 |
| 2017 | $5,118 | $67,365 | $32,556 | $34,809 |
| 2016 | $4,479 | $51,740 | $22,049 | $29,691 |
| 2015 | $4,241 | $42,697 | $19,900 | $22,797 |
| 2014 | $3,590 | $42,697 | $19,900 | $22,797 |
Source: Public Records
Map
Nearby Homes
- 285 31st St
- 316 29th St
- 340 28th St
- 355 32nd St
- 330 32nd St
- 340 27th St
- 325 27th St
- 125 S 33rd St
- 2250 Bluebell Ave
- 3664 Chase Ct
- 805 29th St Unit 452
- 805 29th St Unit 202
- 805 29th St Unit 152
- 805 29th St Unit 459
- 805 29th St Unit 404
- 2221 Columbine Ave
- 3200 Eastman Ave
- 735 32nd St
- 700 33rd St
- 350 Bates Ave
Your Personal Tour Guide
Ask me questions while you tour the home.