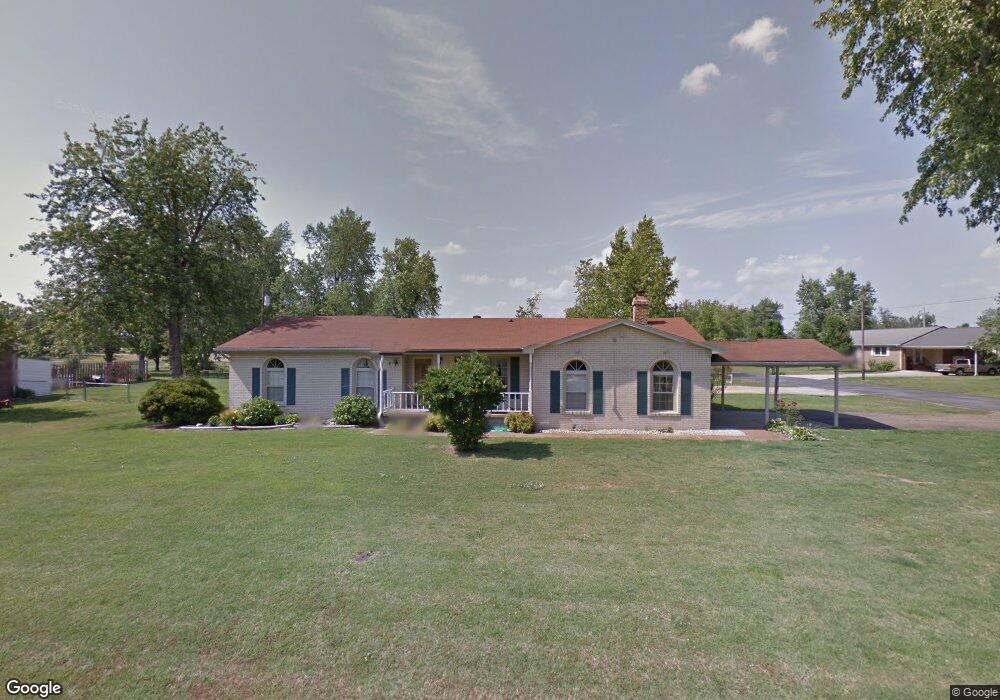
230 Beech St Union City, TN 38261
Estimated Value: $200,000 - $245,000
--
Bed
2
Baths
2,102
Sq Ft
$103/Sq Ft
Est. Value
About This Home
This home is located at 230 Beech St, Union City, TN 38261 and is currently estimated at $216,856, approximately $103 per square foot. 230 Beech St is a home located in Obion County.
Ownership History
Date
Name
Owned For
Owner Type
Purchase Details
Closed on
Apr 21, 2008
Bought by
Cash Michelle
Current Estimated Value
Purchase Details
Closed on
May 30, 2002
Sold by
Donnie Johnson
Bought by
Miller Harold D
Purchase Details
Closed on
Mar 25, 1993
Bought by
Johnson Donnie and Johnson Lettie
Purchase Details
Closed on
Mar 16, 1993
Bought by
Johnson Donnie and Johnson Lettie
Purchase Details
Closed on
Oct 30, 1992
Bought by
First Volunteer Bank
Purchase Details
Closed on
Jul 17, 1990
Bought by
Allen Marshall D and Allen Denise D
Purchase Details
Closed on
Jun 1, 1979
Bought by
Wicks Russel A and Wicks Janet
Create a Home Valuation Report for This Property
The Home Valuation Report is an in-depth analysis detailing your home's value as well as a comparison with similar homes in the area
Home Values in the Area
Average Home Value in this Area
Purchase History
| Date | Buyer | Sale Price | Title Company |
|---|---|---|---|
| Cash Michelle | -- | -- | |
| Miller Harold D | $98,000 | -- | |
| Johnson Donnie | $55,500 | -- | |
| Johnson Donnie | $19,500 | -- | |
| First Volunteer Bank | $68,500 | -- | |
| Allen Marshall D | -- | -- | |
| Wicks Russel A | -- | -- |
Source: Public Records
Tax History Compared to Growth
Tax History
| Year | Tax Paid | Tax Assessment Tax Assessment Total Assessment is a certain percentage of the fair market value that is determined by local assessors to be the total taxable value of land and additions on the property. | Land | Improvement |
|---|---|---|---|---|
| 2024 | -- | $54,450 | $3,750 | $50,700 |
| 2023 | $1,068 | $54,450 | $3,750 | $50,700 |
| 2022 | $940 | $33,600 | $2,000 | $31,600 |
| 2021 | $890 | $33,600 | $2,000 | $31,600 |
| 2020 | $890 | $33,600 | $2,000 | $31,600 |
| 2019 | $847 | $33,600 | $2,000 | $31,600 |
| 2018 | $849 | $33,600 | $2,000 | $31,600 |
| 2017 | $849 | $31,975 | $2,000 | $29,975 |
| 2016 | $849 | $31,975 | $2,000 | $29,975 |
| 2015 | $849 | $31,975 | $2,000 | $29,975 |
| 2014 | $849 | $31,975 | $2,000 | $29,975 |
Source: Public Records
Map
Nearby Homes
- 874 Gum St
- 161 Cedar St
- 370 S Thompson St
- 1535 Lattus Ln
- 3611 W Main St
- 3412 Lakeview Dr
- 3305 Cottonwood Dr
- 0 Burrus Rd
- 604 Denver Dr
- 2703 Salem Dr
- 3694 Pete Gray Rd
- 210 Graham St
- 5680 Floyd Shuck Rd
- 4478 Crystal Rd
- 1428 Meadow Dr
- 2610-2608 Nettle St
- 922 N Division St
- 501 N 1st St
- 903 Sherwood Dr
- 841 Mosswood Dr