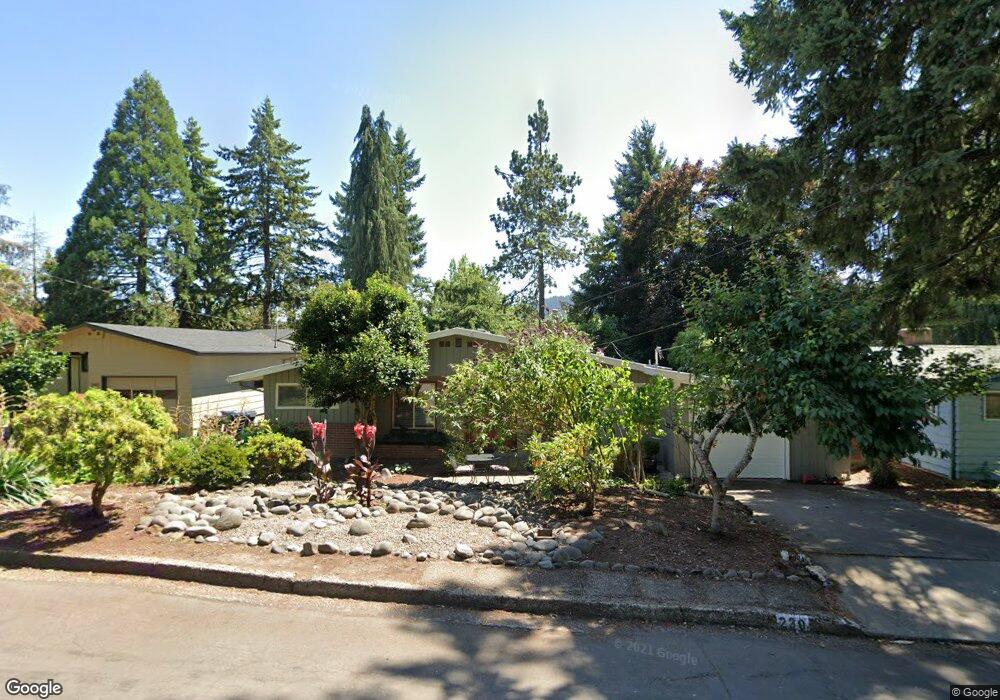
230 E 38th Ave Eugene, OR 97405
Southeast Eugene NeighborhoodEstimated Value: $474,000 - $578,000
3
Beds
2
Baths
1,929
Sq Ft
$269/Sq Ft
Est. Value
About This Home
This home is located at 230 E 38th Ave, Eugene, OR 97405 and is currently estimated at $518,881, approximately $268 per square foot. 230 E 38th Ave is a home located in Lane County with nearby schools including Camas Ridge Community Elementary School, Spencer Butte Middle School, and South Eugene High School.
Ownership History
Date
Name
Owned For
Owner Type
Purchase Details
Closed on
Sep 2, 2021
Sold by
Hess James M and Hemp Elisabeth M
Bought by
Hess James M and Hemp Elisabeth M
Current Estimated Value
Purchase Details
Closed on
Nov 24, 2010
Sold by
Blades Daniel C
Bought by
Hemp Elisabeth M and Hess James M
Home Financials for this Owner
Home Financials are based on the most recent Mortgage that was taken out on this home.
Original Mortgage
$191,200
Outstanding Balance
$122,265
Interest Rate
3.75%
Mortgage Type
New Conventional
Estimated Equity
$396,616
Purchase Details
Closed on
May 17, 2004
Sold by
Blades Frances A
Bought by
Blades Daniel C
Purchase Details
Closed on
Sep 12, 2000
Sold by
Cendant Mobility Services Corp
Bought by
Blades Daniel C and Blades Frances A
Home Financials for this Owner
Home Financials are based on the most recent Mortgage that was taken out on this home.
Original Mortgage
$110,000
Interest Rate
7.65%
Purchase Details
Closed on
Jul 3, 2000
Sold by
Chung Diane M
Bought by
Cendant Mobility Services Corp
Create a Home Valuation Report for This Property
The Home Valuation Report is an in-depth analysis detailing your home's value as well as a comparison with similar homes in the area
Home Values in the Area
Average Home Value in this Area
Purchase History
| Date | Buyer | Sale Price | Title Company |
|---|---|---|---|
| Hess James M | -- | None Available | |
| Hemp Elisabeth M | $239,000 | Cascade Title Company | |
| Blades Daniel C | -- | -- | |
| Blades Daniel C | $150,000 | Western Pioneer Title | |
| Cendant Mobility Services Corp | $174,500 | Western Pioneer Title |
Source: Public Records
Mortgage History
| Date | Status | Borrower | Loan Amount |
|---|---|---|---|
| Open | Hemp Elisabeth M | $191,200 | |
| Previous Owner | Blades Daniel C | $110,000 |
Source: Public Records
Tax History
| Year | Tax Paid | Tax Assessment Tax Assessment Total Assessment is a certain percentage of the fair market value that is determined by local assessors to be the total taxable value of land and additions on the property. | Land | Improvement |
|---|---|---|---|---|
| 2025 | $4,649 | $238,628 | -- | -- |
| 2024 | $4,592 | $231,678 | -- | -- |
| 2023 | $4,592 | $224,931 | $0 | $0 |
| 2022 | $4,301 | $218,380 | $0 | $0 |
| 2021 | $4,040 | $212,020 | $0 | $0 |
| 2020 | $4,054 | $205,845 | $0 | $0 |
| 2019 | $3,916 | $199,850 | $0 | $0 |
| 2018 | $3,679 | $188,379 | $0 | $0 |
| 2017 | $3,483 | $188,379 | $0 | $0 |
| 2016 | $3,335 | $182,892 | $0 | $0 |
| 2015 | $3,239 | $177,565 | $0 | $0 |
| 2014 | $3,199 | $172,393 | $0 | $0 |
Source: Public Records
Map
Nearby Homes
- 275 E 39th Ave
- 170 E 40th Ave
- 434 E 39th Ave
- 4023 Donald St Unit K
- 4083 Donald St Unit A
- 0 E 39th Ave
- 75 W 35th Place
- 320 Dellwood Dr
- 555 Stafford Ct
- 4295 Ferry St
- 585 E 36th Ave
- 357 W 37th Ave
- 3593 Lawrence St
- 17 Westbrook Way
- 21 Westbrook Way
- 453 Dellwood Dr
- 36 Westbrook Way
- 4425 Hilyard St
- 310 1/2 E 31st Ave Unit 1
- 4320 Fox Hollow Rd
Your Personal Tour Guide
Ask me questions while you tour the home.