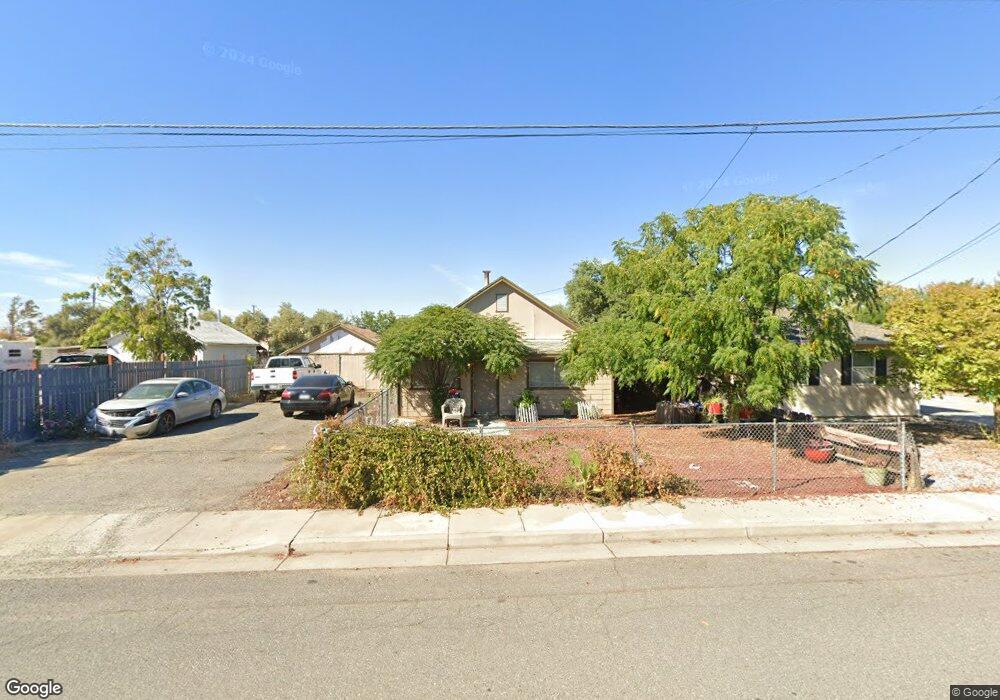
230 E Mill St Orland, CA 95963
Estimated Value: $156,000 - $286,000
2
Beds
1
Bath
816
Sq Ft
$287/Sq Ft
Est. Value
About This Home
This home is located at 230 E Mill St, Orland, CA 95963 and is currently estimated at $233,876, approximately $286 per square foot. 230 E Mill St is a home located in Glenn County with nearby schools including Mill Street Elementary School, Fairview Elementary School, and Price Intermediate School.
Ownership History
Date
Name
Owned For
Owner Type
Purchase Details
Closed on
Mar 10, 2016
Sold by
Lepper Charles and Lepper Janice
Bought by
Ilian Mohammad M
Current Estimated Value
Home Financials for this Owner
Home Financials are based on the most recent Mortgage that was taken out on this home.
Original Mortgage
$50,000
Outstanding Balance
$39,667
Interest Rate
3.72%
Mortgage Type
Seller Take Back
Estimated Equity
$194,209
Purchase Details
Closed on
Jan 21, 2011
Sold by
Lepper Charles V and Lepper Jesse J
Bought by
Lepper Charles
Purchase Details
Closed on
Apr 29, 2003
Sold by
Lepper Dewey V and Lepper Jesse J
Bought by
Lepper Dewey and Lepper Jesse J
Create a Home Valuation Report for This Property
The Home Valuation Report is an in-depth analysis detailing your home's value as well as a comparison with similar homes in the area
Purchase History
| Date | Buyer | Sale Price | Title Company |
|---|---|---|---|
| Ilian Mohammad M | $65,000 | Timios Title | |
| Lepper Charles | -- | Glenn County Title Company | |
| Lepper Dewey | -- | Glenn County Title Co |
Source: Public Records
Mortgage History
| Date | Status | Borrower | Loan Amount |
|---|---|---|---|
| Open | Ilian Mohammad M | $50,000 |
Source: Public Records
Tax History
| Year | Tax Paid | Tax Assessment Tax Assessment Total Assessment is a certain percentage of the fair market value that is determined by local assessors to be the total taxable value of land and additions on the property. | Land | Improvement |
|---|---|---|---|---|
| 2025 | $970 | $85,224 | $37,876 | $47,348 |
| 2024 | $970 | $83,554 | $37,134 | $46,420 |
| 2023 | $942 | $81,916 | $36,406 | $45,510 |
| 2022 | $928 | $80,311 | $35,693 | $44,618 |
| 2021 | $934 | $78,738 | $34,994 | $43,744 |
| 2020 | $934 | $77,932 | $34,636 | $43,296 |
| 2019 | $927 | $76,405 | $33,957 | $42,448 |
| 2018 | $868 | $74,908 | $33,292 | $41,616 |
| 2017 | $900 | $73,440 | $32,640 | $40,800 |
| 2016 | $577 | $47,025 | $25,153 | $21,872 |
| 2015 | $568 | $46,320 | $24,776 | $21,544 |
| 2014 | $558 | $45,413 | $24,291 | $21,122 |
Source: Public Records
Map
Nearby Homes
- 246 E Shasta St
- 919 East St
- 329 Byron Way
- 1682 Almondwood Dr
- 1633 Almondwood Dr
- 325 Byron Way
- 512 East St
- 346 Stanton Way
- 904 E Walker St
- 1645 Olivewood Dr
- 1579 Oakwood Dr
- 1332 East St
- 104 South St
- 303 Colusa St
- 698 Hambright Ave
- 1325 Coby Ln
- 333 Yuba St
- 100 Frances Ln
- 634 Salomon Dr
- 1019 W Monterey St
Your Personal Tour Guide
Ask me questions while you tour the home.