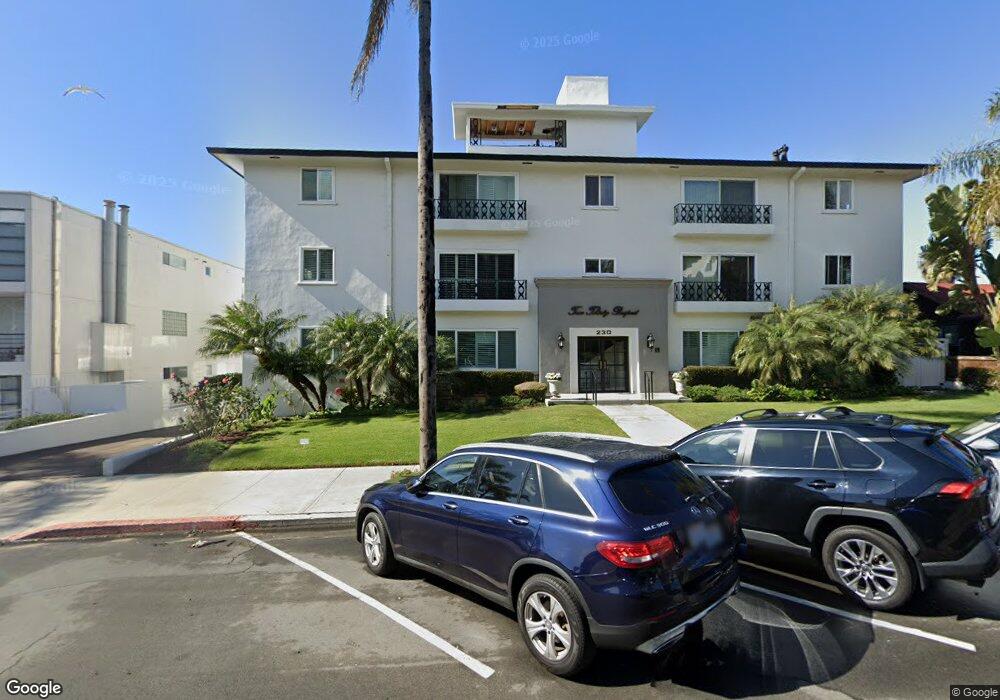
230 Prospect St Unit 15 La Jolla, CA 92037
The Village NeighborhoodEstimated Value: $1,317,674 - $2,015,000
2
Beds
2
Baths
1,249
Sq Ft
$1,198/Sq Ft
Est. Value
About This Home
This home is located at 230 Prospect St Unit 15, La Jolla, CA 92037 and is currently estimated at $1,496,919, approximately $1,198 per square foot. 230 Prospect St Unit 15 is a home located in San Diego County with nearby schools including La Jolla Elementary School, Muirlands Middle School, and La Jolla High School.
Ownership History
Date
Name
Owned For
Owner Type
Purchase Details
Closed on
Mar 30, 2015
Sold by
Ellstrom Kimberly J
Bought by
Ellstrom Kimberly J
Current Estimated Value
Purchase Details
Closed on
Mar 28, 2008
Sold by
Adams Dennis and Adams Bonnie
Bought by
Adams Dennis and Adams Bonnie
Purchase Details
Closed on
May 18, 1999
Sold by
Kimberly Ellstrom and Kimberly J
Bought by
Ellstrom Kimberly J
Home Financials for this Owner
Home Financials are based on the most recent Mortgage that was taken out on this home.
Original Mortgage
$142,525
Outstanding Balance
$36,460
Interest Rate
6.92%
Estimated Equity
$1,460,459
Purchase Details
Closed on
Jan 24, 1994
Sold by
Hickman Georgia A
Bought by
Ellstrom Kimberly
Home Financials for this Owner
Home Financials are based on the most recent Mortgage that was taken out on this home.
Original Mortgage
$146,400
Interest Rate
5.95%
Purchase Details
Closed on
Dec 31, 1986
Purchase Details
Closed on
Aug 23, 1983
Create a Home Valuation Report for This Property
The Home Valuation Report is an in-depth analysis detailing your home's value as well as a comparison with similar homes in the area
Home Values in the Area
Average Home Value in this Area
Purchase History
| Date | Buyer | Sale Price | Title Company |
|---|---|---|---|
| Ellstrom Kimberly J | -- | None Available | |
| Adams Dennis | -- | North American Title Co | |
| Ellstrom Kimberly J | -- | First American Title Ins Co | |
| Ellstrom Kimberly | $183,000 | Guardian Title Company | |
| -- | $143,000 | -- | |
| -- | $133,000 | -- |
Source: Public Records
Mortgage History
| Date | Status | Borrower | Loan Amount |
|---|---|---|---|
| Open | Ellstrom Kimberly J | $142,525 | |
| Closed | Ellstrom Kimberly | $146,400 | |
| Closed | Ellstrom Kimberly | $18,300 |
Source: Public Records
Tax History Compared to Growth
Tax History
| Year | Tax Paid | Tax Assessment Tax Assessment Total Assessment is a certain percentage of the fair market value that is determined by local assessors to be the total taxable value of land and additions on the property. | Land | Improvement |
|---|---|---|---|---|
| 2025 | $3,770 | $310,497 | $186,948 | $123,549 |
| 2024 | $3,770 | $304,410 | $183,283 | $121,127 |
| 2023 | $3,687 | $298,442 | $179,690 | $118,752 |
| 2022 | $3,589 | $292,591 | $176,167 | $116,424 |
| 2021 | $3,565 | $286,855 | $172,713 | $114,142 |
| 2020 | $3,522 | $283,915 | $170,943 | $112,972 |
| 2019 | $3,460 | $278,349 | $167,592 | $110,757 |
| 2018 | $3,235 | $272,892 | $164,306 | $108,586 |
| 2017 | $3,159 | $267,542 | $161,085 | $106,457 |
| 2016 | $3,108 | $262,297 | $157,927 | $104,370 |
| 2015 | $3,063 | $258,358 | $155,555 | $102,803 |
| 2014 | $3,015 | $253,298 | $152,508 | $100,790 |
Source: Public Records
Map
Nearby Homes
- 229 Coast Blvd Unit U1
- 220 Coast Blvd Unit 2M
- 265 Coast Blvd Unit 9
- 202 Coast Blvd Unit 4
- 302 Prospect St Unit 7
- 302 Prospect St Unit 6
- 100 Coast Blvd Unit 101
- 357 Coast Blvd S
- 7520 Draper Ave Unit 3
- 726 Silver St
- 708 Silver St
- 718 Silver St
- 7635 Draper Ave Unit LU4
- 346 Dunemere Dr
- 7560 Eads Ave Unit 12
- 7601 Eads Ave
- 609 Genter St
- 7757 Eads Ave Unit B7
- 607 Arenas St
- 716 Glenview Ln
- 230 Prospect St
- 230 Prospect St Unit 21
- 230 Prospect St Unit 26
- 230 Prospect St Unit 25
- 230 Prospect St Unit 22
- 230 Prospect St Unit 11
- 230 Prospect St Unit 17
- 230 Prospect St Unit 35
- 230 Prospect St Unit 36
- 230 Prospect St Unit 34
- 230 Prospect St Unit 32
- 230 Prospect St Unit 31
- 230 Prospect St Unit 24
- 230 Prospect St Unit 23
- 230 Prospect St Unit 13
- 230 Prospect St Unit 16
- 230 Prospect St Unit 14
- 236 Prospect St Unit 40
- 101 Coast Blvd
- 101 Coast Blvd Unit 4C