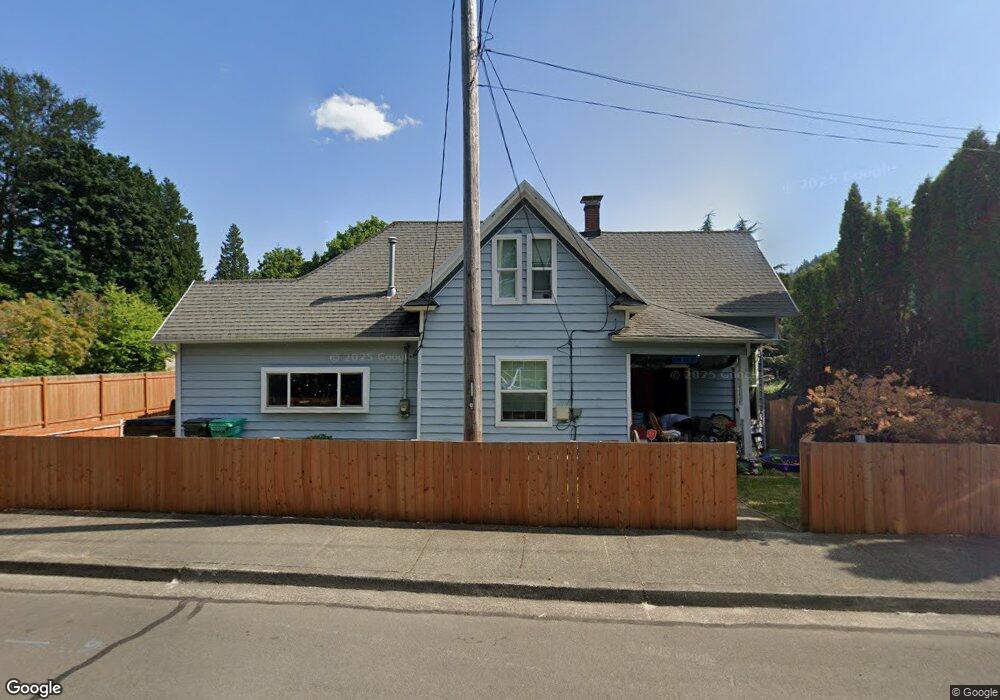
230 SE 2nd St Gresham, OR 97080
Historic Southeast NeighborhoodEstimated Value: $420,000 - $526,000
2
Beds
2
Baths
2,624
Sq Ft
$176/Sq Ft
Est. Value
About This Home
This home is located at 230 SE 2nd St, Gresham, OR 97080 and is currently estimated at $462,594, approximately $176 per square foot. 230 SE 2nd St is a home located in Multnomah County with nearby schools including East Gresham Elementary School, Dexter McCarty Middle School, and Gresham High School.
Ownership History
Date
Name
Owned For
Owner Type
Purchase Details
Closed on
Feb 22, 2022
Sold by
Swoboda Jeremy A
Bought by
Swoboda Jeremy A and Swoboda Kathleen M
Current Estimated Value
Home Financials for this Owner
Home Financials are based on the most recent Mortgage that was taken out on this home.
Original Mortgage
$313,000
Outstanding Balance
$290,090
Interest Rate
3.55%
Mortgage Type
New Conventional
Estimated Equity
$172,504
Purchase Details
Closed on
Mar 15, 2017
Sold by
Autry Pushpa
Bought by
Swoboda Jeremy A and Day Kathleen M
Home Financials for this Owner
Home Financials are based on the most recent Mortgage that was taken out on this home.
Original Mortgage
$267,720
Interest Rate
4.19%
Mortgage Type
New Conventional
Purchase Details
Closed on
Dec 17, 2014
Sold by
Hamilton Roy R
Bought by
Autry Pushpa
Home Financials for this Owner
Home Financials are based on the most recent Mortgage that was taken out on this home.
Original Mortgage
$182,700
Interest Rate
4%
Mortgage Type
New Conventional
Create a Home Valuation Report for This Property
The Home Valuation Report is an in-depth analysis detailing your home's value as well as a comparison with similar homes in the area
Home Values in the Area
Average Home Value in this Area
Purchase History
| Date | Buyer | Sale Price | Title Company |
|---|---|---|---|
| Swoboda Jeremy A | $91,000 | Ticor Title | |
| Swoboda Jeremy A | $276,000 | Fidelity National Title | |
| Autry Pushpa | $203,000 | First American |
Source: Public Records
Mortgage History
| Date | Status | Borrower | Loan Amount |
|---|---|---|---|
| Open | Swoboda Jeremy A | $313,000 | |
| Previous Owner | Swoboda Jeremy A | $267,720 | |
| Previous Owner | Autry Pushpa | $182,700 |
Source: Public Records
Tax History
| Year | Tax Paid | Tax Assessment Tax Assessment Total Assessment is a certain percentage of the fair market value that is determined by local assessors to be the total taxable value of land and additions on the property. | Land | Improvement |
|---|---|---|---|---|
| 2025 | $4,746 | $233,240 | -- | -- |
| 2024 | $4,543 | $226,450 | -- | -- |
| 2023 | $4,139 | $219,860 | $0 | $0 |
| 2022 | $4,024 | $213,460 | $0 | $0 |
| 2021 | $3,923 | $207,250 | $0 | $0 |
| 2020 | $3,691 | $201,220 | $0 | $0 |
| 2019 | $3,594 | $195,360 | $0 | $0 |
| 2018 | $3,427 | $189,670 | $0 | $0 |
| 2017 | $3,288 | $184,150 | $0 | $0 |
| 2016 | $2,899 | $178,790 | $0 | $0 |
Source: Public Records
Map
Nearby Homes
- 415 SE Roberts Ave
- 318 NE Roberts Ave Unit 308
- 318 NE Roberts Ave Unit 203
- 210 NE 5th St
- 0 NE 5th St
- 491 NE Elliott Ave
- 234 NE Cleveland Ave
- 660 NE 9th St
- 894 NE Linden Ave
- 0 NE 6th St
- 4740 SE 2nd St
- 4764 SE 2nd St
- 4667 SE 2nd St
- 638 SW 7th St
- 55 SW Lovhar Dr
- 54 NW 13th St
- 1700 SE 4th St
- 1715 SE 5th St Unit 1725
- 159 SW Florence Ave Unit 64
- 159 SW Florence Ave
- 210 SE 2nd St Unit 220
- 320 SE 2nd St Unit 322
- 295 SE 2nd St
- 225 SE 2nd St
- 303 SE 2nd St Unit 305
- 230 SE Hood Ave Unit 232
- 1234 Nda Required Rd
- 140 SE Roberts Ave
- 154 SE Hood Ave
- 117 SE Hood Ave
- 340 SE 2nd St
- 260 SE Hood Ave Unit 264
- 116 SE Hood Ave
- 337 SE 2nd St
- 120 SE Roberts Ave
- 350 SE 2nd St
- 201 SE Roberts Ave
- 350 SE 2nd St
- 233 SE Beech Ave
Your Personal Tour Guide
Ask me questions while you tour the home.