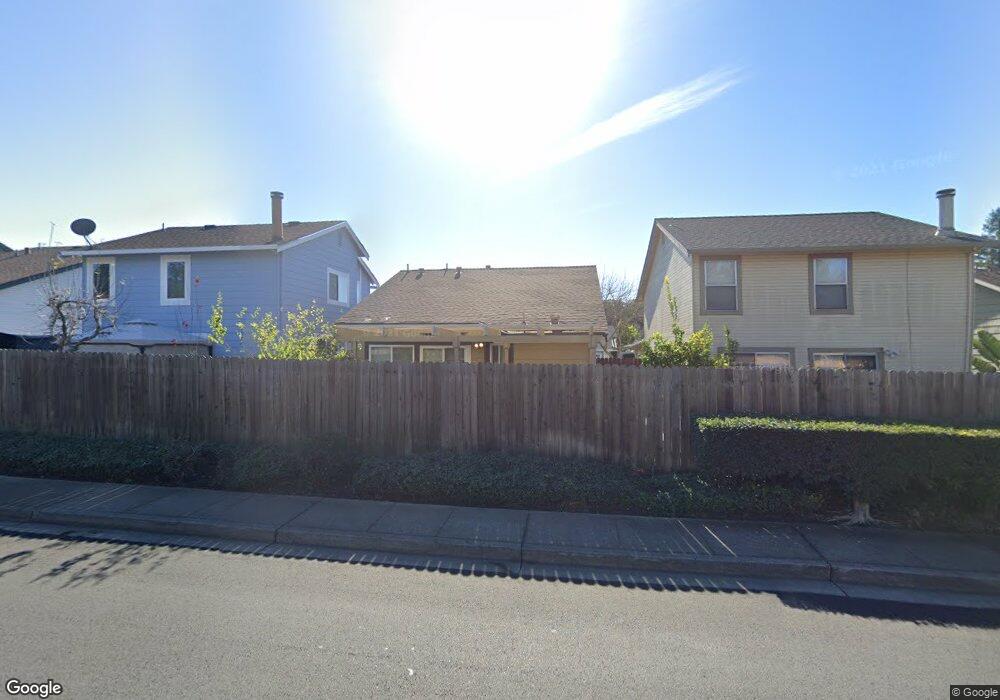
230 Stageline Dr Vallejo, CA 94591
Hunter Ranch NeighborhoodEstimated Value: $390,786 - $450,000
2
Beds
1
Bath
886
Sq Ft
$481/Sq Ft
Est. Value
About This Home
This home is located at 230 Stageline Dr, Vallejo, CA 94591 and is currently estimated at $426,447, approximately $481 per square foot. 230 Stageline Dr is a home located in Solano County with nearby schools including Joseph H. Wardlaw Elementary School, Hogan Middle School, and Jesse M. Bethel High School.
Ownership History
Date
Name
Owned For
Owner Type
Purchase Details
Closed on
Apr 21, 2008
Sold by
Alfonso Constancia Q
Bought by
Alfonso Sheila Q
Current Estimated Value
Home Financials for this Owner
Home Financials are based on the most recent Mortgage that was taken out on this home.
Original Mortgage
$150,000
Outstanding Balance
$94,572
Interest Rate
5.88%
Mortgage Type
Purchase Money Mortgage
Estimated Equity
$331,875
Purchase Details
Closed on
Feb 13, 2008
Sold by
Alfonso Sheila Q
Bought by
Alfonso Sheila Q and Alfonso Constancia Q
Purchase Details
Closed on
May 31, 2002
Sold by
Alfonso Rodolfo F and Alfonso Constancia Q
Bought by
Alfonso Sheila Q
Purchase Details
Closed on
Apr 7, 1994
Sold by
Bruggen Joanne Vander
Bought by
Alfonso Rodolfo F and Alfonso Constancia Q
Home Financials for this Owner
Home Financials are based on the most recent Mortgage that was taken out on this home.
Original Mortgage
$100,000
Interest Rate
4.45%
Create a Home Valuation Report for This Property
The Home Valuation Report is an in-depth analysis detailing your home's value as well as a comparison with similar homes in the area
Home Values in the Area
Average Home Value in this Area
Purchase History
| Date | Buyer | Sale Price | Title Company |
|---|---|---|---|
| Alfonso Sheila Q | -- | Chicago Title Company | |
| Alfonso Sheila Q | -- | None Available | |
| Alfonso Sheila Q | -- | -- | |
| Alfonso Rodolfo F | $125,000 | First Amer Title Guaranty Co |
Source: Public Records
Mortgage History
| Date | Status | Borrower | Loan Amount |
|---|---|---|---|
| Open | Alfonso Sheila Q | $150,000 | |
| Previous Owner | Alfonso Rodolfo F | $100,000 |
Source: Public Records
Tax History Compared to Growth
Tax History
| Year | Tax Paid | Tax Assessment Tax Assessment Total Assessment is a certain percentage of the fair market value that is determined by local assessors to be the total taxable value of land and additions on the property. | Land | Improvement |
|---|---|---|---|---|
| 2025 | $3,463 | $212,461 | $64,583 | $147,878 |
| 2024 | $3,463 | $208,296 | $63,317 | $144,979 |
| 2023 | $3,251 | $204,213 | $62,076 | $142,137 |
| 2022 | $3,139 | $200,209 | $60,859 | $139,350 |
| 2021 | $3,068 | $196,284 | $59,666 | $136,618 |
| 2020 | $3,072 | $194,273 | $59,055 | $135,218 |
| 2019 | $2,968 | $190,465 | $57,898 | $132,567 |
| 2018 | $2,781 | $186,731 | $56,763 | $129,968 |
| 2017 | $2,647 | $183,070 | $55,650 | $127,420 |
| 2016 | $2,077 | $179,481 | $54,559 | $124,922 |
| 2015 | $2,050 | $176,786 | $53,740 | $123,046 |
| 2014 | $1,766 | $151,000 | $42,000 | $109,000 |
Source: Public Records
Map
Nearby Homes
- 400 Foothill Dr
- 2890 Redwood Pkwy Unit 61
- 225 Skyline Dr
- 226 Kathy Ellen Dr
- 121 Kim Ct
- 559 Topley Ct
- 1342 Monteith Dr
- 2011 Agate Ct
- 367 Darley Dr
- 218 Franciscan Dr
- 0 Fairgrounds Dr Unit 325101300
- 133 San Gorgonio Ave
- 272 Woodridge Dr
- 108 San Gorgonio Ave
- 1040 Highland Ave
- 419 Clark Dr
- 257 Mountain View Ave
- 9216 Hallmark Place
- 1132 Waltz Ct
- 1146 Waltz Ct
- 240 Stageline Dr
- 220 Stageline Dr
- 250 Stageline Dr
- 210 Stageline Dr
- 200 Stageline Dr
- 260 260 Stageline Dr Dr
- 223 Stageline Dr
- 235 Stageline Dr
- 247 Stageline Dr
- 211 Stageline Dr
- 184 Stageline Dr
- 270 Stageline Dr
- 263 Stageline Dr
- 172 Stageline Dr
- 280 Stageline Dr
- 183 Stageline Dr
- 632 Buckskin Place
- 285 Stageline Dr
- 203 Cadloni Ln
- 203 Cadloni Ln