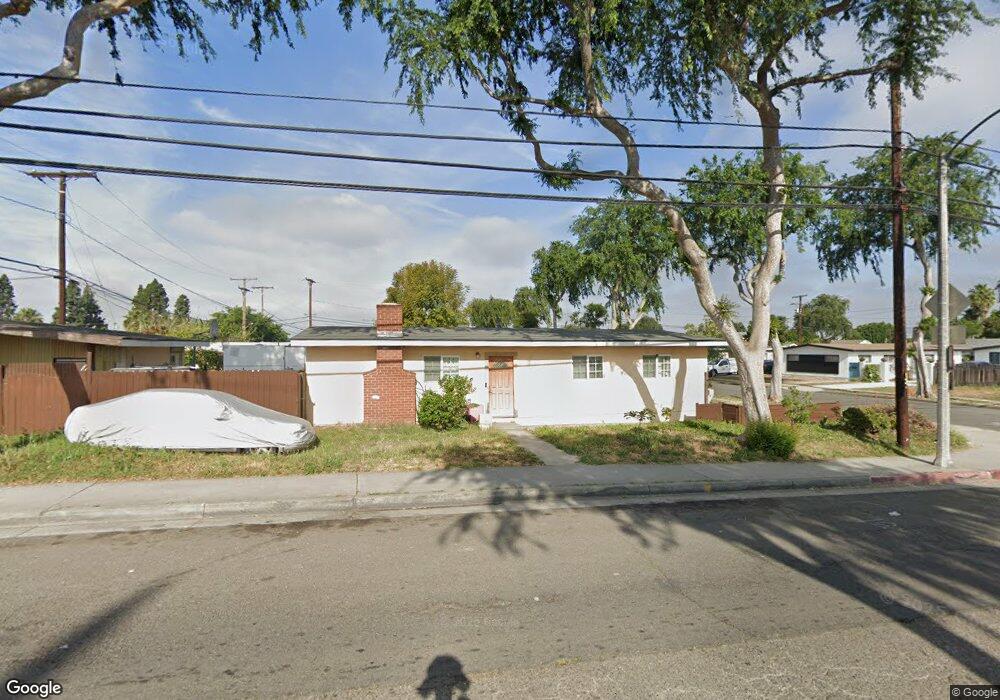
2300 Carol Dr Fullerton, CA 92833
Estimated Value: $828,725 - $895,000
3
Beds
2
Baths
1,190
Sq Ft
$719/Sq Ft
Est. Value
About This Home
This home is located at 2300 Carol Dr, Fullerton, CA 92833 and is currently estimated at $855,931, approximately $719 per square foot. 2300 Carol Dr is a home located in Orange County with nearby schools including Valencia Park Elementary School, Nicolas Junior High School, and Buena Park High School.
Ownership History
Date
Name
Owned For
Owner Type
Purchase Details
Closed on
May 9, 2011
Sold by
Ly Todd
Bought by
Ly Todd and Wang Xiuzhen
Current Estimated Value
Home Financials for this Owner
Home Financials are based on the most recent Mortgage that was taken out on this home.
Original Mortgage
$251,550
Outstanding Balance
$174,493
Interest Rate
4.84%
Mortgage Type
New Conventional
Estimated Equity
$681,438
Purchase Details
Closed on
Jan 20, 2005
Sold by
Wang Xiuzhen
Bought by
Ly Todd
Home Financials for this Owner
Home Financials are based on the most recent Mortgage that was taken out on this home.
Original Mortgage
$270,000
Interest Rate
5.69%
Mortgage Type
New Conventional
Purchase Details
Closed on
Dec 14, 2004
Sold by
Gourd Jesse
Bought by
Ly Todd
Home Financials for this Owner
Home Financials are based on the most recent Mortgage that was taken out on this home.
Original Mortgage
$270,000
Interest Rate
5.69%
Mortgage Type
New Conventional
Purchase Details
Closed on
Feb 23, 1995
Sold by
Gourd Emmanuella M
Bought by
Gourd Raymond E
Create a Home Valuation Report for This Property
The Home Valuation Report is an in-depth analysis detailing your home's value as well as a comparison with similar homes in the area
Purchase History
| Date | Buyer | Sale Price | Title Company |
|---|---|---|---|
| Ly Todd | -- | None Available | |
| Ly Todd | -- | Chicago Title Co | |
| Ly Todd | $386,000 | Chicago Title Co | |
| Gourd Raymond E | -- | -- |
Source: Public Records
Mortgage History
| Date | Status | Borrower | Loan Amount |
|---|---|---|---|
| Open | Ly Todd | $251,550 | |
| Closed | Ly Todd | $270,000 |
Source: Public Records
Tax History
| Year | Tax Paid | Tax Assessment Tax Assessment Total Assessment is a certain percentage of the fair market value that is determined by local assessors to be the total taxable value of land and additions on the property. | Land | Improvement |
|---|---|---|---|---|
| 2025 | $5,944 | $538,042 | $466,030 | $72,012 |
| 2024 | $5,944 | $527,493 | $456,893 | $70,600 |
| 2023 | $5,799 | $517,150 | $447,934 | $69,216 |
| 2022 | $5,759 | $507,010 | $439,151 | $67,859 |
| 2021 | $5,658 | $497,069 | $430,540 | $66,529 |
| 2020 | $5,626 | $491,973 | $426,126 | $65,847 |
| 2019 | $5,479 | $482,327 | $417,771 | $64,556 |
| 2018 | $5,396 | $472,870 | $409,579 | $63,291 |
| 2017 | $5,082 | $443,000 | $389,245 | $53,755 |
| 2016 | $5,069 | $443,000 | $389,245 | $53,755 |
| 2015 | $4,497 | $396,000 | $342,245 | $53,755 |
| 2014 | $3,927 | $346,752 | $292,997 | $53,755 |
Source: Public Records
Map
Nearby Homes
- 2321 Williamson Ave
- 2100 W Valencia Dr
- 134 S Pritchard Ave
- 2404 W Ash Ave
- 3515 W Commonwealth Ave
- 2009 W Oak Ave
- 3604 W Valencia Dr
- 801 S Courtney Ave
- 4014 W Commonwealth Ave
- 804 Creekside Dr Unit 56
- 1836 W Southgate Ave
- 2426 Plaza de Vista
- 2410 W Orangethorpe Ave Unit 6
- 904 Whitewater Dr Unit 6
- 674 Bridgeport Cir Unit 25
- 921 Creekside Dr Unit 131
- 6 Tidewater Cove
- 926 Whitewater Dr Unit 96
- 6982 Crimson Dr
- 1422 Peckham St Unit A
- 2306 Carol Dr Unit 148
- 2218 Carol Dr
- 2312 Carol Dr
- 2301 Carol Dr
- 2307 Carol Dr
- 2212 Carol Dr
- 2316 Carol Dr
- 2219 Carol Dr
- 2313 Carol Dr
- 2213 Carol Dr
- 2206 Carol Dr
- 2320 Carol Dr
- 2317 Carol Dr
- 119 S Gilbert St
- 2207 Carol Dr
- 2324 Carol Dr
- 2321 Carol Dr
- 2312 Williamson Ave
- 2200 Carol Dr
- 2316 Williamson Ave
Your Personal Tour Guide
Ask me questions while you tour the home.