2300 Pebble Beach Trail Oxnard, CA 93036
Windsor North River Ridge NeighborhoodEstimated Value: $963,000 - $1,242,632
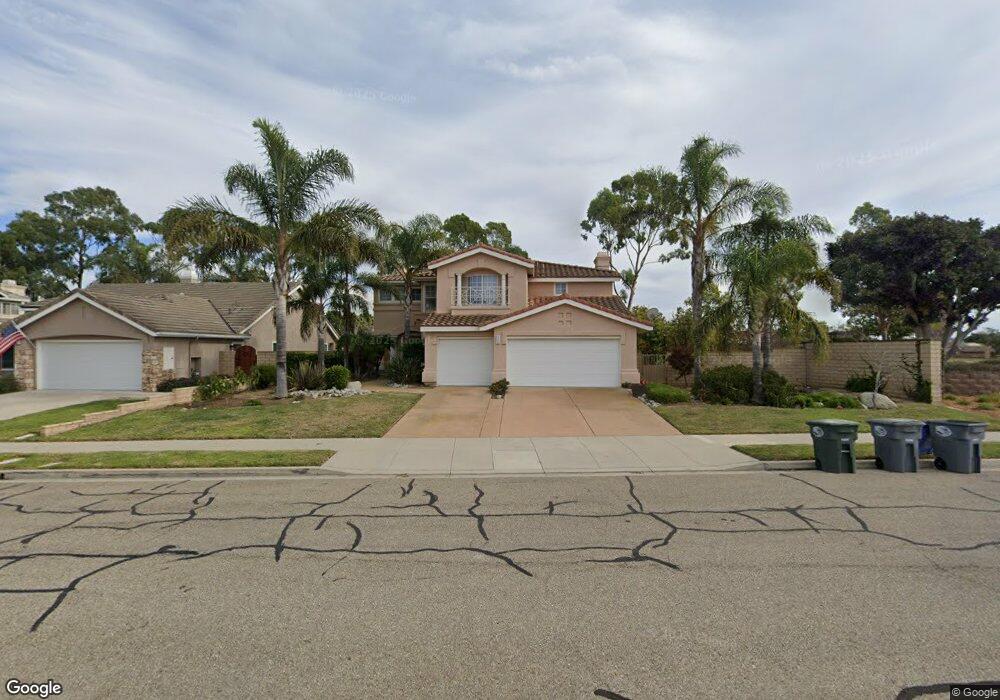
About This Home
This home is located at 2300 Pebble Beach Trail, Oxnard, CA 93036 and is currently estimated at $1,152,408, approximately $426 per square foot. 2300 Pebble Beach Trail is a home located in Ventura County with nearby schools including Thurgood Marshall Elementary School and Oxnard High School.
Ownership History
We collect this data history from publicly available records. To have your information removed, we recommend requesting removal directly through your county’s website.
Purchase Details
Purchase Details
Home Financials for this Owner
Home Financials are based on the most recent Mortgage that was taken out on this home.Home Values in the Area
Average Home Value in this Area
Purchase History
We collect this data history from publicly available records. To have your information removed, we recommend requesting removal directly through your county’s website.
| Date | Buyer | Sale Price | Title Company |
|---|---|---|---|
| -- | None Available | ||
| $273,000 | Continental Lawyers Title Co |
Mortgage History
We collect this data history from publicly available records. To have your information removed, we recommend requesting removal directly through your county’s website.
| Date | Status | Borrower | Loan Amount |
|---|---|---|---|
| Previous Owner | $207,000 |
Tax History
We collect this data history from publicly available records. To have your information removed, we recommend requesting removal directly through your county’s website.
| Year | Tax Paid | Tax Assessment Tax Assessment Total Assessment is a certain percentage of the fair market value that is determined by local assessors to be the total taxable value of land and additions on the property. | Land | Improvement |
|---|---|---|---|---|
| 2025 | $5,335 | $444,563 | $177,822 | $266,741 |
| 2024 | $5,335 | $435,847 | $174,336 | $261,511 |
| 2023 | $5,140 | $427,301 | $170,917 | $256,384 |
| 2022 | $4,984 | $418,923 | $167,566 | $251,357 |
| 2021 | $4,943 | $410,709 | $164,280 | $246,429 |
| 2020 | $5,033 | $406,500 | $162,597 | $243,903 |
| 2019 | $4,890 | $398,530 | $159,409 | $239,121 |
| 2018 | $4,821 | $390,717 | $156,284 | $234,433 |
| 2017 | $4,575 | $383,057 | $153,220 | $229,837 |
| 2016 | $4,423 | $375,547 | $150,216 | $225,331 |
| 2015 | $4,468 | $369,908 | $147,960 | $221,948 |
| 2014 | $5,157 | $362,663 | $145,062 | $217,601 |
Map
- 2321 Diamond Head Way
- 2113 Doral Ct
- 1639 Range Rd
- 2134 Cold Stream Ct
- 1616 Range Rd
- 1600 Mulligan St
- 1951 Augusta Ct
- 1600 Holly Ave
- 1931 Augusta Ct
- 1510 Holly Ave
- 2096 Mission Hills Dr
- 2207 Mariposa St
- 2060 Norma St
- 2040 Olga St
- 1340 Kumquat Place
- 1251 Holly Ave
- 2004 Turnberry Dr
- 2001 Turnberry Dr
- 1000 Fuchsia St
- 1320 Rachel Dr
- 2310 Pebble Beach Trail
- 2320 Pebble Beach Trail
- 2311 Pebble Beach Trail
- 2301 Pebble Beach Trail
- 2321 Pebble Beach Trail
- 2226 Pebble Beach Trail
- 2310 Bayhill Ct
- 2320 Bayhill Ct
- 2224 Pebble Beach Trail
- 2330 Bayhill Ct
- 2340 Bayhill Ct
- 2245 Spyglass Trail W
- 2222 Pebble Beach Trail
- 2300 Bayhill Ct
- 2241 Spyglass Trail W
- 2301 Bayhill Ct
- 2321 Bayhill Ct
- 2331 Bayhill Ct
- 2218 Pebble Beach Trail
- 2311 Bayhill Ct
Ask me questions while you tour the home.