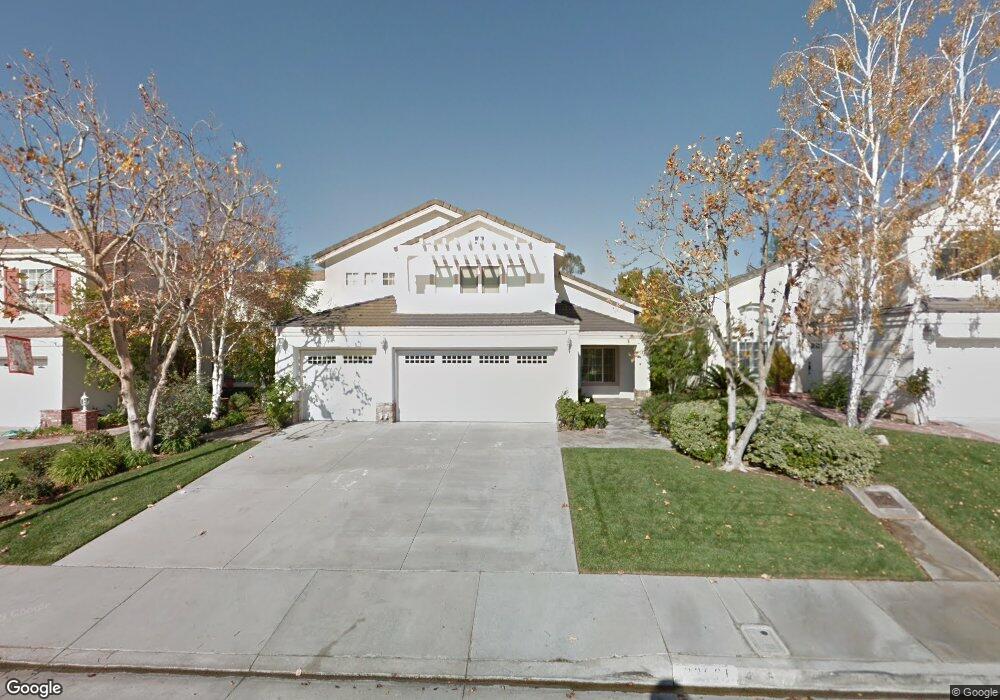
23021 Weymouth Place Valencia, CA 91354
Estimated Value: $985,000 - $1,065,000
3
Beds
3
Baths
2,559
Sq Ft
$396/Sq Ft
Est. Value
About This Home
This home is located at 23021 Weymouth Place, Valencia, CA 91354 and is currently estimated at $1,012,766, approximately $395 per square foot. 23021 Weymouth Place is a home located in Los Angeles County with nearby schools including Charles Helmers Elementary School, Rio Norte Junior High School, and Valencia High School.
Ownership History
Date
Name
Owned For
Owner Type
Purchase Details
Closed on
Mar 31, 2015
Sold by
Wong Paul
Bought by
Wong Paul and The Paul Wong Living Trust
Current Estimated Value
Purchase Details
Closed on
May 31, 2013
Sold by
Wong Paul
Bought by
Wong Paul
Purchase Details
Closed on
Feb 15, 2001
Sold by
Everett A T
Bought by
Wong Paul and Wong Annie
Home Financials for this Owner
Home Financials are based on the most recent Mortgage that was taken out on this home.
Original Mortgage
$240,000
Outstanding Balance
$86,562
Interest Rate
7.06%
Estimated Equity
$926,204
Purchase Details
Closed on
May 28, 1997
Sold by
Thomas Thomas W
Bought by
Everett A T and Everett S
Home Financials for this Owner
Home Financials are based on the most recent Mortgage that was taken out on this home.
Original Mortgage
$223,500
Interest Rate
7.12%
Mortgage Type
Assumption
Create a Home Valuation Report for This Property
The Home Valuation Report is an in-depth analysis detailing your home's value as well as a comparison with similar homes in the area
Home Values in the Area
Average Home Value in this Area
Purchase History
| Date | Buyer | Sale Price | Title Company |
|---|---|---|---|
| Wong Paul | -- | None Available | |
| Wong Paul | -- | Stewart Title | |
| Wong Paul | $379,000 | Investors Title | |
| Everett A T | $298,000 | Investors Title Company |
Source: Public Records
Mortgage History
| Date | Status | Borrower | Loan Amount |
|---|---|---|---|
| Open | Wong Paul | $240,000 | |
| Previous Owner | Everett A T | $223,500 |
Source: Public Records
Tax History Compared to Growth
Tax History
| Year | Tax Paid | Tax Assessment Tax Assessment Total Assessment is a certain percentage of the fair market value that is determined by local assessors to be the total taxable value of land and additions on the property. | Land | Improvement |
|---|---|---|---|---|
| 2025 | $8,542 | $571,071 | $254,042 | $317,029 |
| 2024 | $8,542 | $559,874 | $249,061 | $310,813 |
| 2023 | $8,316 | $548,897 | $244,178 | $304,719 |
| 2022 | $8,326 | $538,136 | $239,391 | $298,745 |
| 2021 | $8,096 | $527,586 | $234,698 | $292,888 |
| 2019 | $7,753 | $511,939 | $227,738 | $284,201 |
| 2018 | $7,613 | $501,902 | $223,273 | $278,629 |
| 2016 | $7,114 | $482,414 | $214,604 | $267,810 |
| 2015 | $6,876 | $475,169 | $211,381 | $263,788 |
| 2014 | $6,848 | $465,862 | $207,241 | $258,621 |
Source: Public Records
Map
Nearby Homes
- 22949 Sycamore Creek Dr
- 27371 Blueridge Dr
- 27240 Trenton Place
- 27302 Weathersfield Dr
- 22903 Vista Delgado Dr
- 27127 Rio Bosque Dr
- 27362 Santa Clarita Rd
- 27439 Santa Clarita Rd
- 22660 La Rochelle Dr
- 22654 La Rochelle Dr
- 27545 Wellsley Way
- 29412 Via Azul
- 24308 Corte Tiburon
- 29416 Via Azul
- 24313 Camino Oceano
- 24310 Camino Oceano
- 29368 Via Destello
- 29610 Corte Ballenas
- 24317 Camino Oceano
- 27503 Wellsley Way
- 23017 Weymouth Place
- 23029 Weymouth Place
- 23013 Weymouth Place
- 23020 Weymouth Place
- 23033 Weymouth Place
- 23024 Weymouth Place
- 23016 Weymouth Place
- 23009 Weymouth Place
- 23028 Weymouth Place
- 22996 Sycamore Creek Dr
- 23037 Weymouth Place
- 23032 Weymouth Place
- 23005 Weymouth Place
- 23012 Weymouth Place
- 23036 Weymouth Place
- 22980 Sycamore Creek Dr
- 23010 Weymouth Place
- 23041 Weymouth Place
- 23003 Weymouth Place
- 23008 Weymouth Place