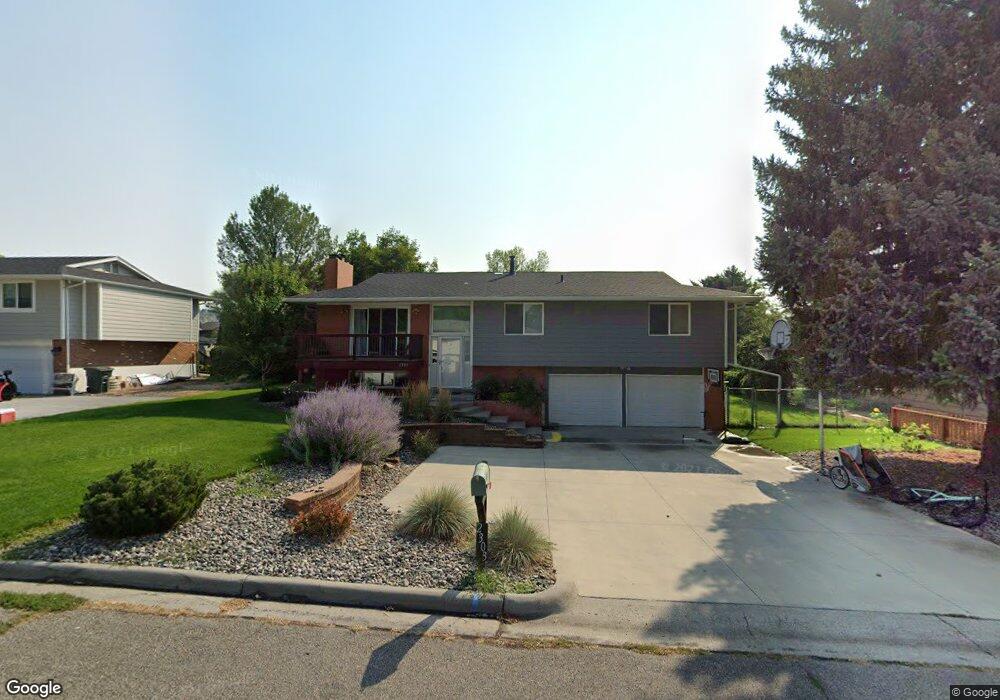
2303 41st St W Billings, MT 59106
West Shiloh NeighborhoodEstimated Value: $412,000 - $515,000
4
Beds
3
Baths
2,700
Sq Ft
$164/Sq Ft
Est. Value
About This Home
This home is located at 2303 41st St W, Billings, MT 59106 and is currently estimated at $442,667, approximately $163 per square foot. 2303 41st St W is a home located in Yellowstone County with nearby schools including Arrowhead School, Ben Steele Middle School, and Billings West High School.
Ownership History
Date
Name
Owned For
Owner Type
Purchase Details
Closed on
Aug 26, 2009
Sold by
Rowan Matthew A and Rowan Stephanie S
Bought by
Swartz Andy L and Swartz Susan Lori
Current Estimated Value
Home Financials for this Owner
Home Financials are based on the most recent Mortgage that was taken out on this home.
Original Mortgage
$160,000
Outstanding Balance
$104,106
Interest Rate
5.09%
Mortgage Type
New Conventional
Estimated Equity
$338,561
Purchase Details
Closed on
Apr 30, 2007
Sold by
Lais Development Inc
Bought by
Rowan Matthew A and Rowan Stephanie S
Home Financials for this Owner
Home Financials are based on the most recent Mortgage that was taken out on this home.
Original Mortgage
$116,975
Interest Rate
6.11%
Mortgage Type
Purchase Money Mortgage
Purchase Details
Closed on
Jul 14, 2006
Sold by
Dahle Jared S and Dahle Wendy C
Bought by
Lais Development Inc
Create a Home Valuation Report for This Property
The Home Valuation Report is an in-depth analysis detailing your home's value as well as a comparison with similar homes in the area
Home Values in the Area
Average Home Value in this Area
Purchase History
| Date | Buyer | Sale Price | Title Company |
|---|---|---|---|
| Swartz Andy L | -- | None Available | |
| Rowan Matthew A | -- | None Available | |
| Lais Development Inc | -- | None Available |
Source: Public Records
Mortgage History
| Date | Status | Borrower | Loan Amount |
|---|---|---|---|
| Open | Swartz Andy L | $160,000 | |
| Previous Owner | Rowan Matthew A | $116,975 |
Source: Public Records
Tax History Compared to Growth
Tax History
| Year | Tax Paid | Tax Assessment Tax Assessment Total Assessment is a certain percentage of the fair market value that is determined by local assessors to be the total taxable value of land and additions on the property. | Land | Improvement |
|---|---|---|---|---|
| 2025 | $2,970 | $371,200 | $62,160 | $309,040 |
| 2024 | $2,970 | $300,300 | $58,921 | $241,379 |
| 2023 | $2,987 | $300,300 | $58,921 | $241,379 |
| 2022 | $2,379 | $252,000 | $0 | $0 |
| 2021 | $2,700 | $252,000 | $0 | $0 |
| 2020 | $2,729 | $244,800 | $0 | $0 |
| 2019 | $2,605 | $244,800 | $0 | $0 |
| 2018 | $2,466 | $226,600 | $0 | $0 |
| 2017 | $2,395 | $226,600 | $0 | $0 |
| 2016 | $2,179 | $207,800 | $0 | $0 |
| 2015 | $2,131 | $207,800 | $0 | $0 |
| 2014 | $2,185 | $114,427 | $0 | $0 |
Source: Public Records
Map
Nearby Homes
- 2213 Westfield Dr
- 4044 Backwoods Dr
- 2631 Country Ln
- 3953 Rimrock Rd
- 3928 Audubon Way
- 3743 Hayden Dr
- 3023 Melrose Ln
- 5045 Audubon Way
- 5073 Audubon Way
- 1747 Tiburon Ln
- 1713 Tiburon Ln
- 3957 Palisades Park Dr
- 3617 Marjorie Dr
- 4022 Laredo Place
- 3316 Laredo Place
- 3945 Laredo Place
- 4416 Pine Cove Rd
- 4265 Laredo Place
- 3441 Poly Dr Unit 15
- 2510 Zimmerman Trail