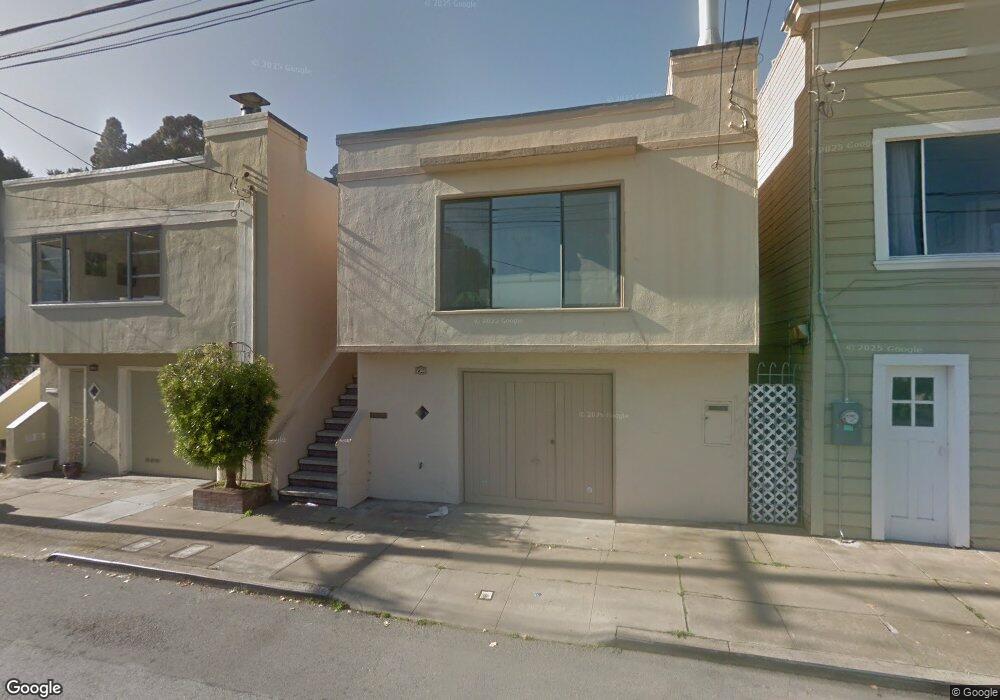
2306 Castro St San Francisco, CA 94131
Noe Valley NeighborhoodEstimated Value: $1,790,000 - $3,658,627
2
Beds
1
Bath
1,050
Sq Ft
$2,918/Sq Ft
Est. Value
About This Home
This home is located at 2306 Castro St, San Francisco, CA 94131 and is currently estimated at $3,064,157, approximately $2,918 per square foot. 2306 Castro St is a home located in San Francisco County with nearby schools including Glen Park Elementary School, James Lick Middle School, and St. Philip School.
Ownership History
Date
Name
Owned For
Owner Type
Purchase Details
Closed on
Jun 17, 2013
Sold by
Hyatt Elizabeth A and The Elizabeth A Hyatt Revocabl
Bought by
Khubchandani Jyoti and Purohit Atul
Current Estimated Value
Home Financials for this Owner
Home Financials are based on the most recent Mortgage that was taken out on this home.
Original Mortgage
$800,800
Outstanding Balance
$569,389
Interest Rate
3.48%
Mortgage Type
New Conventional
Estimated Equity
$2,494,768
Purchase Details
Closed on
Jul 29, 2004
Sold by
Hyatt Elizabeth A
Bought by
Hyatt Elizabeth A and The Elizabeth A Hyatt Revocabl
Create a Home Valuation Report for This Property
The Home Valuation Report is an in-depth analysis detailing your home's value as well as a comparison with similar homes in the area
Home Values in the Area
Average Home Value in this Area
Purchase History
| Date | Buyer | Sale Price | Title Company |
|---|---|---|---|
| Khubchandani Jyoti | $1,001,000 | Old Republic Title Company | |
| Hyatt Elizabeth A | -- | -- |
Source: Public Records
Mortgage History
| Date | Status | Borrower | Loan Amount |
|---|---|---|---|
| Open | Khubchandani Jyoti | $800,800 |
Source: Public Records
Tax History Compared to Growth
Tax History
| Year | Tax Paid | Tax Assessment Tax Assessment Total Assessment is a certain percentage of the fair market value that is determined by local assessors to be the total taxable value of land and additions on the property. | Land | Improvement |
|---|---|---|---|---|
| 2025 | $19,907 | $1,662,437 | $862,855 | $799,582 |
| 2024 | $19,907 | $1,629,842 | $845,937 | $783,905 |
| 2023 | $19,562 | $1,597,885 | $829,350 | $768,535 |
| 2022 | $19,183 | $1,566,555 | $813,089 | $753,466 |
| 2021 | $15,247 | $1,133,816 | $797,147 | $336,669 |
| 2020 | $13,807 | $1,092,974 | $788,974 | $304,000 |
| 2019 | $12,476 | $998,704 | $733,504 | $265,200 |
| 2018 | $10,244 | $823,338 | $758,338 | $65,000 |
| 2017 | $9,078 | $743,469 | $743,469 | $0 |
| 2016 | $12,720 | $1,051,426 | $728,892 | $322,534 |
| 2015 | $12,562 | $1,035,634 | $717,944 | $317,690 |
| 2014 | $12,116 | $1,005,544 | $703,881 | $301,663 |
Source: Public Records
Map
Nearby Homes