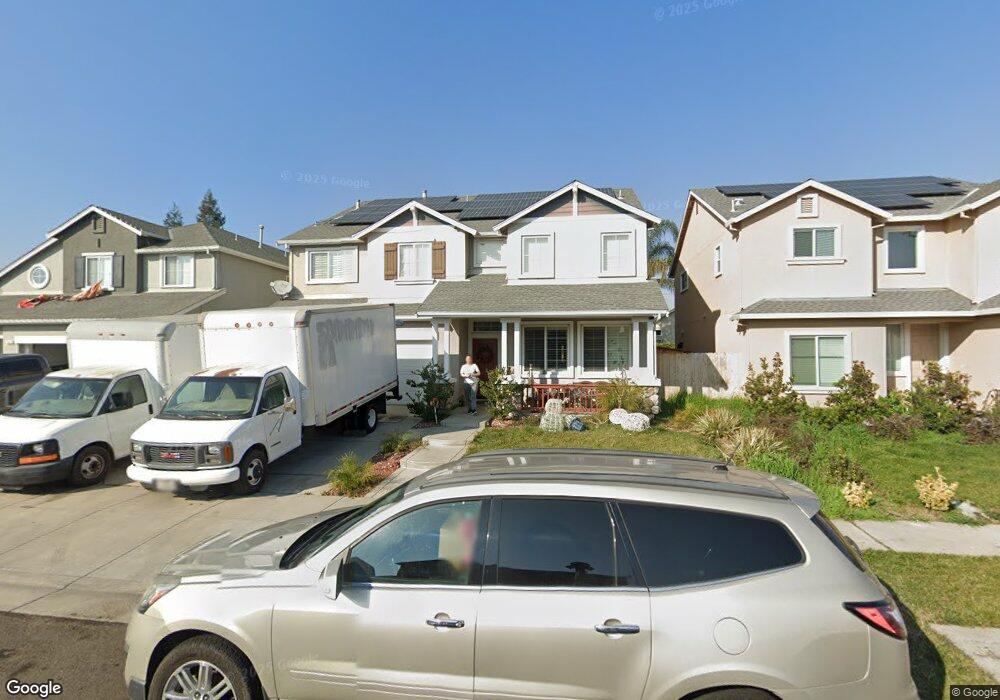
2307 Starboard Ln Stockton, CA 95206
South Stockton NeighborhoodEstimated Value: $517,465 - $597,000
4
Beds
3
Baths
2,555
Sq Ft
$213/Sq Ft
Est. Value
About This Home
This home is located at 2307 Starboard Ln, Stockton, CA 95206 and is currently estimated at $545,116, approximately $213 per square foot. 2307 Starboard Ln is a home located in San Joaquin County with nearby schools including Monroe Elementary School, Alexander Hamilton Elementary, and Van Buren Elementary School.
Ownership History
Date
Name
Owned For
Owner Type
Purchase Details
Closed on
Jun 6, 2016
Sold by
Granados Juana
Bought by
Padilla Ivan A and Padilla Colleen
Current Estimated Value
Home Financials for this Owner
Home Financials are based on the most recent Mortgage that was taken out on this home.
Original Mortgage
$290,638
Outstanding Balance
$231,692
Interest Rate
3.62%
Mortgage Type
FHA
Estimated Equity
$313,424
Purchase Details
Closed on
Mar 3, 2016
Sold by
Herrera Carla Alejandra
Bought by
Granados Juana
Purchase Details
Closed on
Jun 9, 2008
Sold by
Stockton Seabreeze L P
Bought by
Granados Juana and Herrera Carla Alejandra
Home Financials for this Owner
Home Financials are based on the most recent Mortgage that was taken out on this home.
Original Mortgage
$220,000
Interest Rate
5.87%
Mortgage Type
Purchase Money Mortgage
Create a Home Valuation Report for This Property
The Home Valuation Report is an in-depth analysis detailing your home's value as well as a comparison with similar homes in the area
Home Values in the Area
Average Home Value in this Area
Purchase History
| Date | Buyer | Sale Price | Title Company |
|---|---|---|---|
| Padilla Ivan A | $301,000 | Fidelity National Title Co | |
| Granados Juana | -- | Accommodation | |
| Granados Juana | $275,000 | Old Republic Title Company |
Source: Public Records
Mortgage History
| Date | Status | Borrower | Loan Amount |
|---|---|---|---|
| Open | Padilla Ivan A | $290,638 | |
| Previous Owner | Granados Juana | $220,000 |
Source: Public Records
Tax History Compared to Growth
Tax History
| Year | Tax Paid | Tax Assessment Tax Assessment Total Assessment is a certain percentage of the fair market value that is determined by local assessors to be the total taxable value of land and additions on the property. | Land | Improvement |
|---|---|---|---|---|
| 2025 | $4,797 | $356,315 | $124,887 | $231,428 |
| 2024 | $4,681 | $349,330 | $122,439 | $226,891 |
| 2023 | $4,542 | $342,482 | $120,039 | $222,443 |
| 2022 | $4,488 | $335,768 | $117,686 | $218,082 |
| 2021 | $4,299 | $329,185 | $115,379 | $213,806 |
| 2020 | $4,375 | $325,810 | $114,196 | $211,614 |
| 2019 | $4,338 | $319,422 | $111,957 | $207,465 |
| 2018 | $4,243 | $313,160 | $109,762 | $203,398 |
| 2017 | $3,980 | $307,020 | $107,610 | $199,410 |
| 2016 | $3,861 | $283,000 | $84,000 | $199,000 |
| 2015 | $3,747 | $270,000 | $92,000 | $178,000 |
| 2014 | $3,529 | $261,000 | $78,000 | $183,000 |
Source: Public Records
Map
Nearby Homes
- 2343 Tidewind Dr
- 2150 Michael Ave
- 3338 Zamora Way
- 3349 Zamora Way
- Plan 2541 at Parkside at Kennedy Ranch
- Plan 2308 Modeled at Parkside at Kennedy Ranch
- Plan 1934 Modeled at Parkside at Kennedy Ranch
- Plan 1718 at Parkside at Kennedy Ranch
- Plan 1481 Modeled at Parkside at Kennedy Ranch
- 2321 Amboy Ave
- 2288 E Loomis Rd
- 3226 Vermillion Dr
- 2318 E Loomis Rd
- 2328 E Loomis Rd
- 2348 E Loomis Rd
- 4326 Highbridge Ln
- 4032 California 99 Unit 3
- 3028 Malisa Way
- 3204 Volney St
- 3435 Marfargoa Rd Unit 74
- 2241 Starboard Ln
- 2315 Starboard Ln
- 2304 Catamaran Way
- 2233 Starboard Ln
- 2323 Starboard Ln
- 2246 Catamaran Way
- 2312 Catamaran Way
- 2238 Catamaran Way
- 2320 Catamaran Way
- 2225 Starboard Ln
- 2306 Starboard Ln
- 2331 Starboard Ln
- 2240 Starboard Ln
- 2314 Starboard Ln
- 2230 Catamaran Way
- 2232 Starboard Ln
- 2322 Starboard Ln
- 2328 Catamaran Way
- 2217 Starboard Ln
- 2339 Starboard Ln