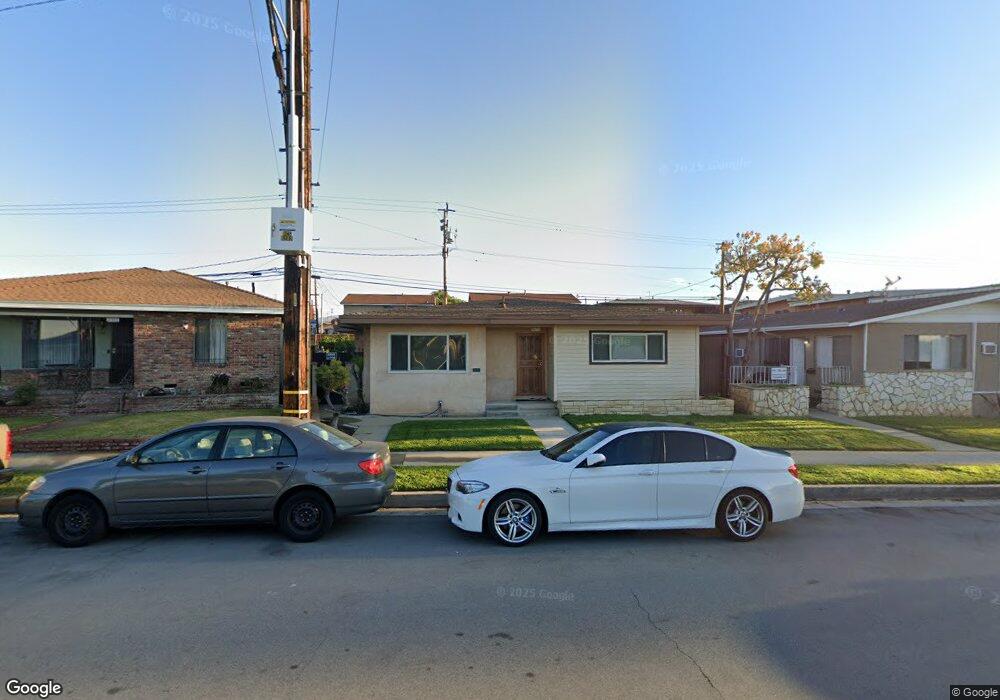
2308 W Via Corona Montebello, CA 90640
Estimated Value: $790,000 - $870,000
3
Beds
3
Baths
1,395
Sq Ft
$593/Sq Ft
Est. Value
About This Home
This home is located at 2308 W Via Corona, Montebello, CA 90640 and is currently estimated at $826,909, approximately $592 per square foot. 2308 W Via Corona is a home located in Los Angeles County with nearby schools including Wilcox Elementary School, Montebello Intermediate School, and Montebello High School.
Ownership History
Date
Name
Owned For
Owner Type
Purchase Details
Closed on
Mar 17, 2010
Sold by
Doppieri Susan and Trust Of Joe A Sr & Grace A Do
Bought by
Lui Chung Fai and Zhang Sarina
Current Estimated Value
Home Financials for this Owner
Home Financials are based on the most recent Mortgage that was taken out on this home.
Original Mortgage
$273,000
Outstanding Balance
$180,305
Interest Rate
4.91%
Mortgage Type
New Conventional
Estimated Equity
$646,604
Create a Home Valuation Report for This Property
The Home Valuation Report is an in-depth analysis detailing your home's value as well as a comparison with similar homes in the area
Home Values in the Area
Average Home Value in this Area
Purchase History
| Date | Buyer | Sale Price | Title Company |
|---|---|---|---|
| Lui Chung Fai | $365,000 | Investors Title Company |
Source: Public Records
Mortgage History
| Date | Status | Borrower | Loan Amount |
|---|---|---|---|
| Open | Lui Chung Fai | $273,000 |
Source: Public Records
Tax History Compared to Growth
Tax History
| Year | Tax Paid | Tax Assessment Tax Assessment Total Assessment is a certain percentage of the fair market value that is determined by local assessors to be the total taxable value of land and additions on the property. | Land | Improvement |
|---|---|---|---|---|
| 2025 | $7,083 | $471,004 | $242,666 | $228,338 |
| 2024 | $7,083 | $461,769 | $237,908 | $223,861 |
| 2023 | $7,063 | $452,716 | $233,244 | $219,472 |
| 2022 | $6,826 | $443,840 | $228,671 | $215,169 |
| 2021 | $6,587 | $435,138 | $224,188 | $210,950 |
| 2019 | $6,301 | $422,234 | $217,540 | $204,694 |
| 2018 | $6,347 | $413,956 | $213,275 | $200,681 |
| 2016 | $6,081 | $397,885 | $204,995 | $192,890 |
| 2015 | $5,758 | $391,909 | $201,916 | $189,993 |
| 2014 | $5,681 | $384,233 | $197,961 | $186,272 |
Source: Public Records
Map
Nearby Homes
- 341 Morris Place
- 345 N 20th St
- 538 N 20th St
- 2429 W Cleveland Ave
- 616 Via Altamira
- 601 N Garfield Ave
- 2912 W Via Acosta
- 113 N 19th St
- 2232 Northside Dr
- 678 Saybrook Ave
- 3016 W Via Corona
- 6674 Easton St
- 2208 W Olympic Blvd
- 413 Brady Ave
- 1500 Aldea Dr
- 6501 E Olympic Blvd
- 1323 W Lincoln Ave
- 6434 E Olympic Blvd
- 833 N 16th St
- 861 Marconi St
- 2304 W Via Corona
- 2312 W Via Corona
- 2316 W Via Corona
- 2315 W Beverly Blvd
- 2317 W Beverly Blvd
- 2311 W Beverly Blvd
- 2321 W Beverly Blvd
- 421 Morris Place
- 2313 W Via Corona
- 2307 W Beverly Blvd
- 2305 W Beverly Blvd
- 2309 W Beverly Blvd
- 2325 W Beverly Blvd
- 2317 W Via Corona
- 2400 W Via Corona
- 417 Morris Place
- 2401 W Via Corona
- 2233 W Beverly Blvd
- 464 N Via Val Verde
- 2404 W Via Corona