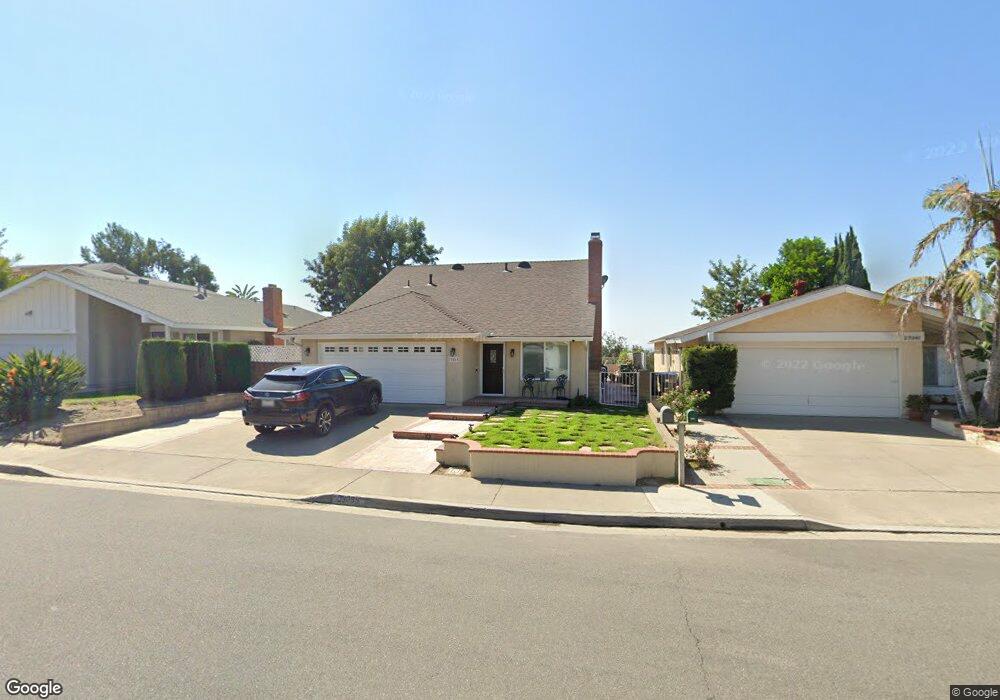
23085 Via San Gabriel Mission Viejo, CA 92691
Estimated Value: $1,096,000 - $1,262,000
4
Beds
2
Baths
1,463
Sq Ft
$788/Sq Ft
Est. Value
About This Home
This home is located at 23085 Via San Gabriel, Mission Viejo, CA 92691 and is currently estimated at $1,152,154, approximately $787 per square foot. 23085 Via San Gabriel is a home located in Orange County with nearby schools including Castille Elementary School, Newhart Middle School, and Capistrano Valley High School.
Ownership History
Date
Name
Owned For
Owner Type
Purchase Details
Closed on
Aug 11, 2005
Sold by
Sinclair Nayla
Bought by
Sinclair Nayla and The Nayla Sinclair Trust
Current Estimated Value
Purchase Details
Closed on
Dec 5, 2002
Sold by
Abboud Pierre A
Bought by
Sinclair Nayla
Home Financials for this Owner
Home Financials are based on the most recent Mortgage that was taken out on this home.
Original Mortgage
$190,000
Interest Rate
6.06%
Purchase Details
Closed on
Sep 16, 1999
Sold by
Nayla Sincair and Nayla N
Bought by
Sinclair Nayla
Home Financials for this Owner
Home Financials are based on the most recent Mortgage that was taken out on this home.
Original Mortgage
$25,000
Interest Rate
7.89%
Mortgage Type
Stand Alone Second
Purchase Details
Closed on
Aug 22, 1997
Sold by
Saad Afif
Bought by
Sincair Nayla
Create a Home Valuation Report for This Property
The Home Valuation Report is an in-depth analysis detailing your home's value as well as a comparison with similar homes in the area
Home Values in the Area
Average Home Value in this Area
Purchase History
| Date | Buyer | Sale Price | Title Company |
|---|---|---|---|
| Sinclair Nayla | -- | -- | |
| Sinclair Nayla | -- | First American Title Co | |
| Sinclair Nayla | -- | First American Title Ins Co | |
| Sincair Nayla | -- | -- |
Source: Public Records
Mortgage History
| Date | Status | Borrower | Loan Amount |
|---|---|---|---|
| Closed | Sinclair Nayla | $190,000 | |
| Closed | Sinclair Nayla | $25,000 |
Source: Public Records
Tax History Compared to Growth
Tax History
| Year | Tax Paid | Tax Assessment Tax Assessment Total Assessment is a certain percentage of the fair market value that is determined by local assessors to be the total taxable value of land and additions on the property. | Land | Improvement |
|---|---|---|---|---|
| 2025 | $2,642 | $271,438 | $148,738 | $122,700 |
| 2024 | $2,642 | $266,116 | $145,821 | $120,295 |
| 2023 | $2,584 | $260,899 | $142,962 | $117,937 |
| 2022 | $2,534 | $255,784 | $140,159 | $115,625 |
| 2021 | $2,484 | $250,769 | $137,411 | $113,358 |
| 2020 | $2,458 | $248,198 | $136,002 | $112,196 |
| 2019 | $2,409 | $243,332 | $133,335 | $109,997 |
| 2018 | $2,361 | $238,561 | $130,720 | $107,841 |
| 2017 | $2,314 | $233,884 | $128,157 | $105,727 |
| 2016 | $2,268 | $229,299 | $125,645 | $103,654 |
| 2015 | $2,249 | $225,855 | $123,757 | $102,098 |
| 2014 | $2,205 | $221,431 | $121,332 | $100,099 |
Source: Public Records
Map
Nearby Homes
- 23336 Via Bahia
- 23372 Via Bahia
- 22735 Via Santa Rosa
- 26702 Via Linares
- 23441 Via Ronda
- 27197 Via Aurora
- 23251 Via Guadix
- 23032 Sonoita
- 26451 Via Juanita
- 26591 Montecito Ln
- 22792 Orellana
- 23606 Via Navarra
- 27241 Via Burgos
- 22922 Vía Nuez
- 23382 Via Chiripa
- 23201 Via Mirlo
- 26328 Via Roble Unit 28
- 26331 Via Lara
- 26253 Via Roble Unit 14
- 26368 Via Roble Unit 24
- 23081 Via San Gabriel
- 23091 Via San Gabriel
- 23075 Via San Gabriel
- 23095 Via San Gabriel
- 23111 Via San Gabriel
- 23071 Via San Gabriel
- 23072 Via San Gabriel
- 23082 Via San Gabriel
- 23092 Via San Gabriel
- 23121 Via San Gabriel
- 23096 Via San Gabriel
- 23051 Via San Gabriel
- 23112 Via San Gabriel
- 23131 Via San Gabriel
- 23131 Via San Gabriel
- 23042 Via San Gabriel
- 23122 Via San Gabriel
- 23041 Via San Gabriel
- 23132 Via San Gabriel
- 23036 Via San Gabriel