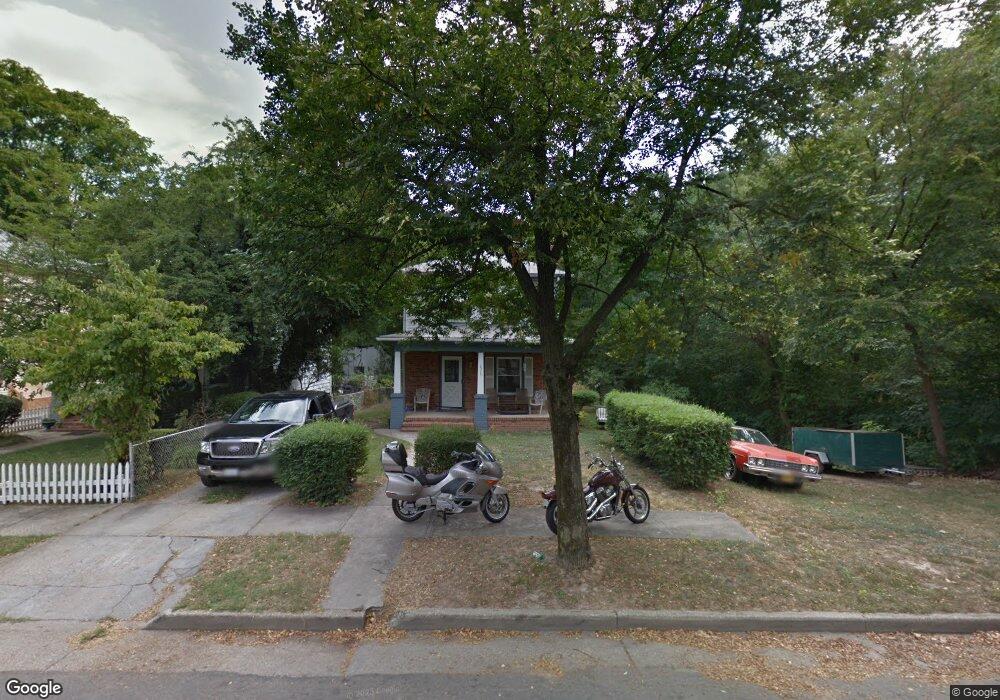
2309 5th Ave Richmond, VA 23222
Chestnut Hill NeighborhoodEstimated Value: $277,000 - $306,000
4
Beds
2
Baths
1,512
Sq Ft
$190/Sq Ft
Est. Value
About This Home
This home is located at 2309 5th Ave, Richmond, VA 23222 and is currently estimated at $287,408, approximately $190 per square foot. 2309 5th Ave is a home located in Richmond City with nearby schools including Overby-Sheppard Elementary School, Henderson Middle School, and Open High School.
Ownership History
Date
Name
Owned For
Owner Type
Purchase Details
Closed on
Mar 11, 2002
Bought by
Williams Herman K and Williams Joyce D
Current Estimated Value
Home Financials for this Owner
Home Financials are based on the most recent Mortgage that was taken out on this home.
Original Mortgage
$35,000
Outstanding Balance
$14,569
Interest Rate
7.01%
Mortgage Type
New Conventional
Estimated Equity
$272,839
Create a Home Valuation Report for This Property
The Home Valuation Report is an in-depth analysis detailing your home's value as well as a comparison with similar homes in the area
Home Values in the Area
Average Home Value in this Area
Purchase History
| Date | Buyer | Sale Price | Title Company |
|---|---|---|---|
| Williams Herman K | -- | -- |
Source: Public Records
Mortgage History
| Date | Status | Borrower | Loan Amount |
|---|---|---|---|
| Open | Williams Herman K | $35,000 |
Source: Public Records
Tax History Compared to Growth
Tax History
| Year | Tax Paid | Tax Assessment Tax Assessment Total Assessment is a certain percentage of the fair market value that is determined by local assessors to be the total taxable value of land and additions on the property. | Land | Improvement |
|---|---|---|---|---|
| 2025 | $1,932 | $161,000 | $60,000 | $101,000 |
| 2024 | $1,872 | $156,000 | $58,000 | $98,000 |
| 2023 | $1,872 | $156,000 | $58,000 | $98,000 |
| 2022 | $1,584 | $132,000 | $42,000 | $90,000 |
| 2021 | $1,440 | $120,000 | $32,000 | $88,000 |
| 2020 | $680 | $120,000 | $32,000 | $88,000 |
| 2019 | $2,001 | $106,000 | $23,000 | $83,000 |
| 2018 | $1,212 | $101,000 | $23,000 | $78,000 |
| 2017 | $1,212 | $101,000 | $22,000 | $79,000 |
| 2016 | $1,176 | $98,000 | $22,000 | $76,000 |
| 2015 | $1,742 | $97,000 | $22,000 | $75,000 |
| 2014 | $1,742 | $93,000 | $22,000 | $71,000 |
Source: Public Records
Map
Nearby Homes