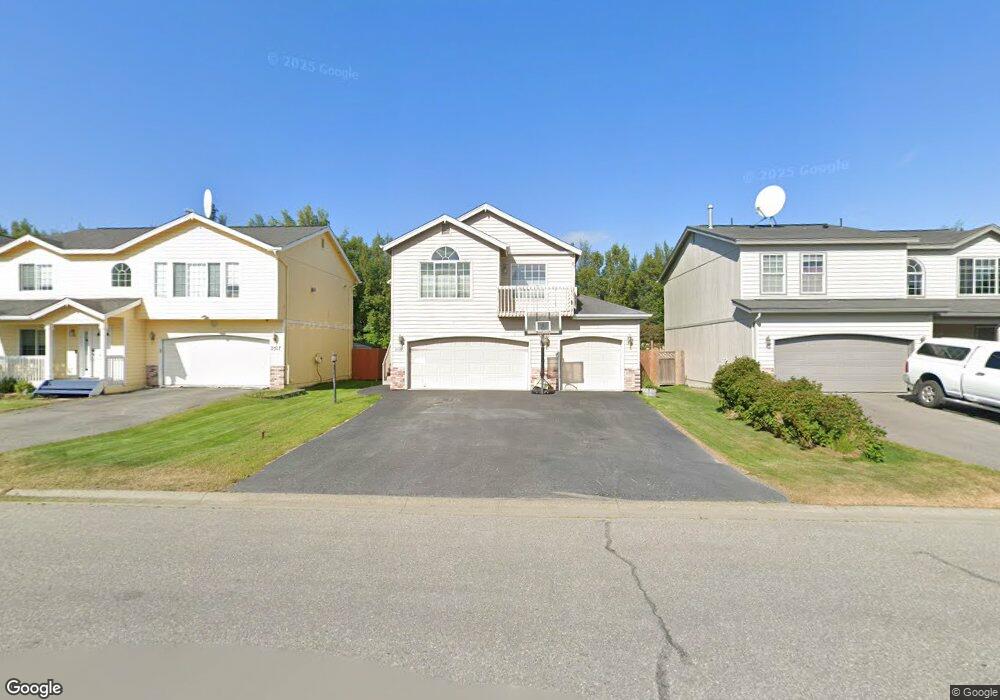
2309 Casey Cusack Loop Anchorage, AK 99515
Bayshore-Klatt NeighborhoodEstimated Value: $374,000 - $556,000
3
Beds
3
Baths
1,662
Sq Ft
$270/Sq Ft
Est. Value
About This Home
This home is located at 2309 Casey Cusack Loop, Anchorage, AK 99515 and is currently estimated at $448,914, approximately $270 per square foot. 2309 Casey Cusack Loop is a home located in Anchorage Municipality with nearby schools including Klatt Elementary School, Goldenview Middle School, and South Anchorage High School.
Ownership History
Date
Name
Owned For
Owner Type
Purchase Details
Closed on
Dec 17, 2024
Sold by
Hall Lisa D and Aquino Christopher
Bought by
Aquino Christopher
Current Estimated Value
Purchase Details
Closed on
Apr 17, 2013
Sold by
Aquino Christopher and Hall Lisa D
Bought by
Aquino Christopher and Aquino Lisa
Home Financials for this Owner
Home Financials are based on the most recent Mortgage that was taken out on this home.
Original Mortgage
$142,400
Interest Rate
3.51%
Mortgage Type
New Conventional
Purchase Details
Closed on
Jun 14, 2002
Sold by
Salvadori Gabriel V and Salvadori Virginia P
Bought by
Aquino Christopher and Hall Lisa D
Home Financials for this Owner
Home Financials are based on the most recent Mortgage that was taken out on this home.
Original Mortgage
$206,755
Interest Rate
6.74%
Mortgage Type
FHA
Purchase Details
Closed on
Dec 29, 1999
Sold by
Hultquist Construction Inc
Bought by
Salvadori Gabriel V and Salvadori Virginia P
Home Financials for this Owner
Home Financials are based on the most recent Mortgage that was taken out on this home.
Original Mortgage
$179,050
Interest Rate
7.68%
Mortgage Type
New Conventional
Create a Home Valuation Report for This Property
The Home Valuation Report is an in-depth analysis detailing your home's value as well as a comparison with similar homes in the area
Home Values in the Area
Average Home Value in this Area
Purchase History
| Date | Buyer | Sale Price | Title Company |
|---|---|---|---|
| Aquino Christopher | -- | None Listed On Document | |
| Aquino Christopher | -- | None Listed On Document | |
| Aquino Christopher | -- | Atga | |
| Aquino Christopher | -- | -- | |
| Salvadori Gabriel V | -- | -- |
Source: Public Records
Mortgage History
| Date | Status | Borrower | Loan Amount |
|---|---|---|---|
| Previous Owner | Aquino Christopher | $142,400 | |
| Previous Owner | Aquino Christopher | $206,755 | |
| Previous Owner | Salvadori Gabriel V | $179,050 |
Source: Public Records
Tax History
| Year | Tax Paid | Tax Assessment Tax Assessment Total Assessment is a certain percentage of the fair market value that is determined by local assessors to be the total taxable value of land and additions on the property. | Land | Improvement |
|---|---|---|---|---|
| 2025 | $6,824 | $443,900 | $88,000 | $355,900 |
| 2024 | $6,824 | $422,700 | $88,000 | $334,700 |
| 2023 | $6,551 | $384,700 | $88,000 | $296,700 |
| 2022 | $6,227 | $369,800 | $88,000 | $281,800 |
| 2021 | $6,057 | $336,100 | $88,000 | $248,100 |
| 2020 | $5,637 | $331,600 | $88,000 | $243,600 |
| 2019 | $5,435 | $332,200 | $88,000 | $244,200 |
| 2018 | $5,343 | $325,800 | $88,000 | $237,800 |
| 2017 | $4,997 | $319,100 | $88,000 | $231,100 |
| 2016 | $4,056 | $317,200 | $85,000 | $232,200 |
| 2015 | $4,056 | $312,700 | $85,000 | $227,700 |
| 2014 | $4,056 | $294,100 | $85,000 | $209,100 |
Source: Public Records
Map
Nearby Homes
- 11500 Jennifer Ann Cir
- 2005 Casey Cusack Loop
- 1850 Vashon Cir
- 2855 Diligence Cir
- 11402 Discovery Park Dr Unit 16B
- 2356 Leander Cir
- 3099 Seclusion Cove Dr Unit 24
- L8 B8 Spartan Dr
- 3121 Marathon Cir
- 1030 Allison Cir
- L5 B8 Spartan Dr
- L6 B8 Spartan Dr
- 3000 Admiralty Bay Dr
- L27 B2 Laurel Acres
- 3017 Bettles Bay Loop
- 10031 Eshamy Bay Dr
- 10031 Zeus Cir
- 3101 Bettles Bay Loop
- 10545 Vancouver Cir
- 3511 Amber Bay Loop
- 2301 Casey Cusack Loop
- 2317 Casey Cusack Loop
- 2261 Casey Cusack Loop
- 2325 Casey Cusack Loop
- 2253 Casey Cusack Loop
- 2333 Casey Cusack Loop
- 2245 Casey Cusack Loop
- 2341 Casey Cusack Loop
- 2324 Casey Cusack Loop
- 2143 Kimberly Lyn Cir
- 2332 Casey Cusack Loop
- 2239 Casey Cusack Loop
- 2133 Kimberly Lyn Cir
- 2349 Casey Cusack Loop
- 2340 Casey Cusack Loop
- 11510 Jennifer Ann Cir
- 2231 Casey Cusack Loop
- 2125 Kimberly Lyn Cir
- 2150 Casey Cusack Loop
- 1946 Casey Cusack Loop
Your Personal Tour Guide
Ask me questions while you tour the home.