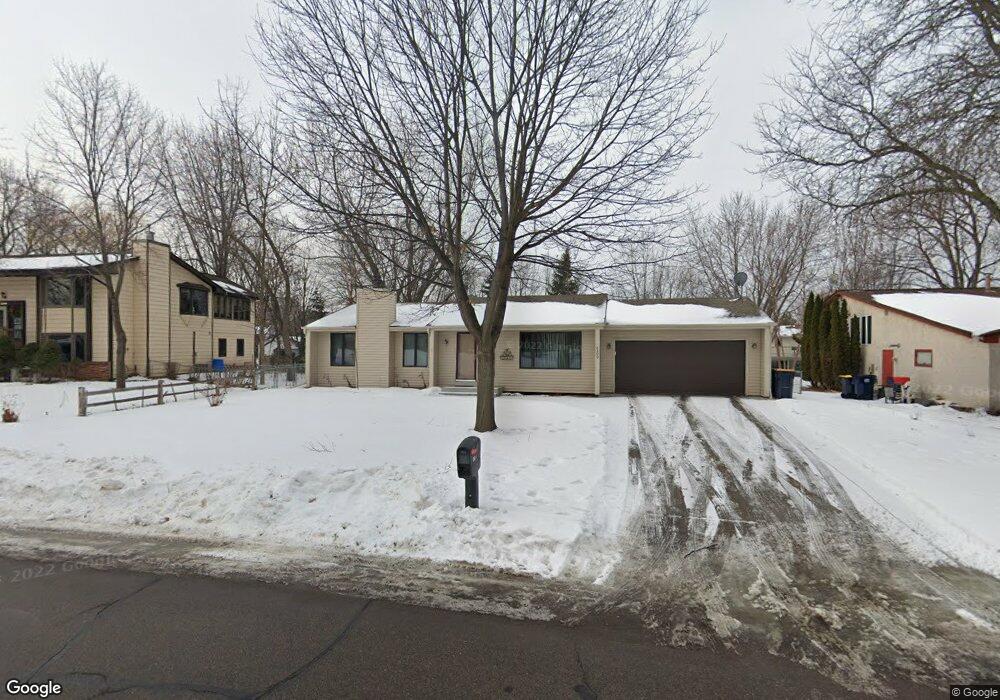
2309 E 115th St Burnsville, MN 55337
Estimated Value: $381,175 - $407,000
3
Beds
2
Baths
1,100
Sq Ft
$355/Sq Ft
Est. Value
About This Home
This home is located at 2309 E 115th St, Burnsville, MN 55337 and is currently estimated at $391,044, approximately $355 per square foot. 2309 E 115th St is a home located in Dakota County with nearby schools including Burnsville High School, Gateway STEM Academy, and Sunrise International Montessori School.
Ownership History
Date
Name
Owned For
Owner Type
Purchase Details
Closed on
Jul 16, 2025
Sold by
State Of Minnesota
Bought by
City Of Burnsville
Current Estimated Value
Purchase Details
Closed on
Apr 16, 2024
Sold by
Ray Daniel and Ray Lora
Bought by
Lorbiecki Steven and Bourdow Jessica
Home Financials for this Owner
Home Financials are based on the most recent Mortgage that was taken out on this home.
Original Mortgage
$364,800
Interest Rate
6.94%
Mortgage Type
New Conventional
Purchase Details
Closed on
Nov 10, 2016
Sold by
Kvittem Ross C and Schieck Jeanine A
Bought by
Ray Daniel Christopher and Ray Lora Lynn
Home Financials for this Owner
Home Financials are based on the most recent Mortgage that was taken out on this home.
Original Mortgage
$70,000
Interest Rate
4%
Mortgage Type
Adjustable Rate Mortgage/ARM
Create a Home Valuation Report for This Property
The Home Valuation Report is an in-depth analysis detailing your home's value as well as a comparison with similar homes in the area
Home Values in the Area
Average Home Value in this Area
Purchase History
| Date | Buyer | Sale Price | Title Company |
|---|---|---|---|
| City Of Burnsville | -- | None Listed On Document | |
| Lorbiecki Steven | $380,000 | -- | |
| Ray Daniel Christopher | $260,000 | Home Title Inc |
Source: Public Records
Mortgage History
| Date | Status | Borrower | Loan Amount |
|---|---|---|---|
| Previous Owner | Lorbiecki Steven | $364,800 | |
| Previous Owner | Ray Daniel Christopher | $70,000 |
Source: Public Records
Tax History Compared to Growth
Tax History
| Year | Tax Paid | Tax Assessment Tax Assessment Total Assessment is a certain percentage of the fair market value that is determined by local assessors to be the total taxable value of land and additions on the property. | Land | Improvement |
|---|---|---|---|---|
| 2024 | $3,580 | $340,600 | $90,100 | $250,500 |
| 2023 | $3,580 | $344,900 | $90,200 | $254,700 |
| 2022 | $2,994 | $339,700 | $90,000 | $249,700 |
| 2021 | $2,968 | $287,400 | $78,200 | $209,200 |
| 2020 | $2,962 | $271,500 | $71,400 | $200,100 |
| 2019 | $2,800 | $261,800 | $68,000 | $193,800 |
| 2018 | $2,791 | $237,900 | $64,700 | $173,200 |
| 2017 | $2,587 | $230,700 | $61,600 | $169,100 |
| 2016 | $2,575 | $212,700 | $58,700 | $154,000 |
| 2015 | $2,404 | $185,447 | $51,740 | $133,707 |
| 2014 | -- | $180,542 | $50,512 | $130,030 |
| 2013 | -- | $161,358 | $45,343 | $116,015 |
Source: Public Records
Map
Nearby Homes
- 2001 Woods Ln
- 11036 27th Ave S
- 11311 W River Hills Dr
- 11115 Carver Ct
- 11017 27th Ave S
- 3017 Mcleod St
- 1601 Raleigh Dr
- 11459 Galtier Dr
- 10934 Southview Dr
- 2200 Horizon Rd
- 11900 Highland View Cir
- 11902 River Hills Cir
- 3108 Foxpoint Cir
- 1800 Riverwood Dr Unit 110
- 1800 Riverwood Dr Unit 323
- 1853 Riverwood Dr Unit 4
- 11921 Baypoint Dr
- 4427 Cinnamon Ridge Cir
- 4425 Cinnamon Ridge Cir
- 4413 Slater Rd
- 2401 E 115th St
- 2305 E 115th St
- 11513 23rd Ave S
- 11509 23rd Ave S
- 11517 23rd Ave S
- 11505 23rd Ave S
- 2405 E 115th St
- 11501 23rd Ave S
- 2408 E 115th St
- 11521 23rd Ave S
- 2400 E 115th St
- 11525 23rd Ave S
- 2501 E 115th St
- 11529 23rd Ave S
- 11512 23rd Ave S
- 2304 E 115th St
- 2500 E 115th St
- 2406 E 115th St
- 2402 E 115th St
- 11532 23rd Ave S