2309 Warfield Way Unit D San Jose, CA 95122
Yerba Buena NeighborhoodEstimated Value: $645,000 - $723,658
About This Home
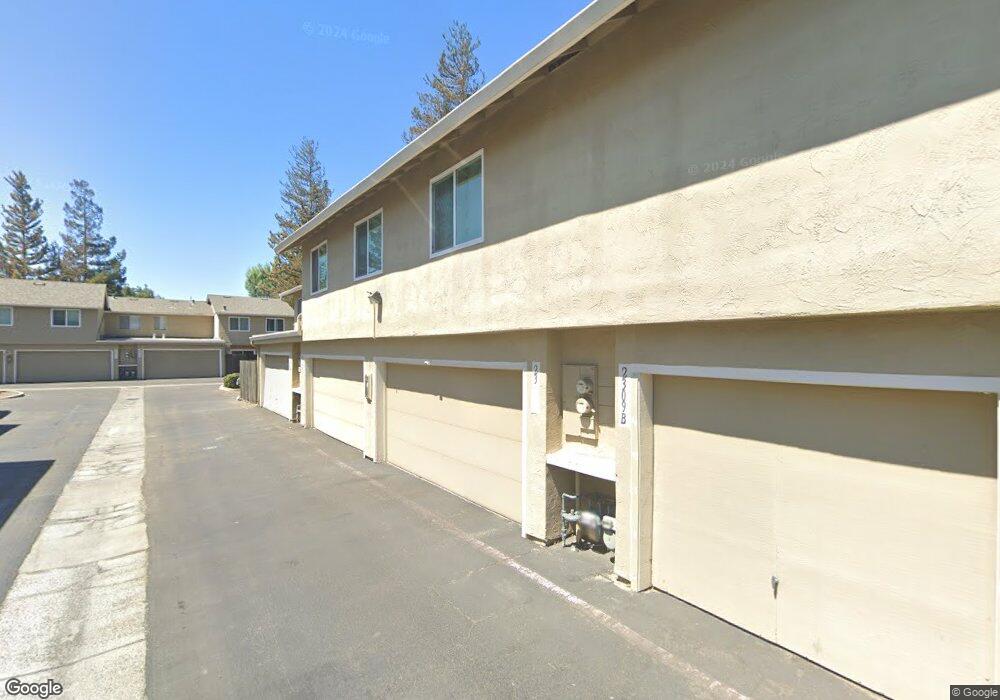
This home is located at 2309 Warfield Way Unit D, San Jose, CA 95122 and is currently estimated at $697,415, approximately $619 per square foot. 2309 Warfield Way Unit D is a home located in Santa Clara County with nearby schools including Stonegate Elementary School, Sylvandale Middle School, and Yerba Buena High School.
Ownership History
We collect this data history from publicly available records. To have your information removed, we recommend requesting removal directly through your county’s website.
Purchase Details
Home Financials for this Owner
Home Financials are based on the most recent Mortgage that was taken out on this home.Purchase Details
Home Financials for this Owner
Home Financials are based on the most recent Mortgage that was taken out on this home.Purchase Details
Purchase Details
Purchase Details
Purchase Details
Purchase Details
Purchase Details
Home Financials for this Owner
Home Financials are based on the most recent Mortgage that was taken out on this home.Purchase Details
Home Financials for this Owner
Home Financials are based on the most recent Mortgage that was taken out on this home.Purchase Details
Home Financials for this Owner
Home Financials are based on the most recent Mortgage that was taken out on this home.Purchase Details
Home Financials for this Owner
Home Financials are based on the most recent Mortgage that was taken out on this home.Home Values in the Area
Average Home Value in this Area
Purchase History
We collect this data history from publicly available records. To have your information removed, we recommend requesting removal directly through your county’s website.
| Date | Buyer | Sale Price | Title Company |
|---|---|---|---|
| -- | First American Title | ||
| $700,000 | First American Title | ||
| -- | First American Title | ||
| -- | None Listed On Document | ||
| -- | -- | ||
| -- | None Available | ||
| $210,000 | Lawyers Title | ||
| $198,750 | None Available | ||
| $477,000 | First American Title Company | ||
| $165,000 | First American Title Company | ||
| $335,000 | Fidelity National Title Ins | ||
| -- | Commonwealth Land Title Co |
Mortgage History
We collect this data history from publicly available records. To have your information removed, we recommend requesting removal directly through your county’s website.
| Date | Status | Borrower | Loan Amount |
|---|---|---|---|
| Open | $350,000 | ||
| Previous Owner | $95,400 | ||
| Previous Owner | $381,600 | ||
| Previous Owner | $288,750 | ||
| Previous Owner | $268,000 | ||
| Previous Owner | $156,000 | ||
| Closed | $19,500 | ||
| Closed | $50,250 | ||
| Closed | $41,250 |
Tax History
We collect this data history from publicly available records. To have your information removed, we recommend requesting removal directly through your county’s website.
| Year | Tax Paid | Tax Assessment Tax Assessment Total Assessment is a certain percentage of the fair market value that is determined by local assessors to be the total taxable value of land and additions on the property. | Land | Improvement |
|---|---|---|---|---|
| 2025 | $10,654 | $714,000 | $357,000 | $357,000 |
| 2024 | $10,262 | $700,000 | $350,000 | $350,000 |
| 2023 | $10,651 | $725,000 | $362,500 | $362,500 |
| 2022 | $4,571 | $254,818 | $127,409 | $127,409 |
| 2021 | $4,517 | $249,822 | $124,911 | $124,911 |
| 2020 | $4,302 | $247,262 | $123,631 | $123,631 |
| 2019 | $4,122 | $242,414 | $121,207 | $121,207 |
| 2018 | $4,104 | $237,662 | $118,831 | $118,831 |
| 2017 | $4,047 | $233,002 | $116,501 | $116,501 |
| 2016 | $3,848 | $228,434 | $114,217 | $114,217 |
| 2015 | $3,773 | $225,004 | $112,502 | $112,502 |
| 2014 | $3,291 | $220,598 | $110,299 | $110,299 |
Map
- 2315 Warfield Way Unit B
- 2102 Galveston Ave Unit B
- 2309 Mclaughlin Ave Unit 5
- 2336 Mclaughlin Ave
- 1166 Spokane Dr
- 2217 Summereve Ct
- 1028 Summermist Ct
- 1034 Summermist Ct
- 2261 Summerton Dr Unit 32
- 1092 Indian Summer Ct Unit 14
- 1107 Indian Summer Ct
- 2669 Kendrick Cir
- 2282 Denair Ave
- 2252 Denair Ave
- 2570 Senter Rd
- 1274 Mayhew Dr
- 1079 Drexel Way
- 1518 Denali Way
- 2697 Lone Bluff Way
- 2701 Lone Bluff Way Unit 18
- 2315 Warfield Way Unit D
- 2315 Warfield Way Unit C
- 2315 Warfield Way Unit A
- 2309 Warfield Way Unit D
- 2309 Warfield Way Unit C
- 2309 Warfield Way Unit B
- 2309 Warfield Way Unit A
- 2334 Warfield Way Unit C
- 2334 Warfield Way Unit B
- 2334 Warfield Way Unit A
- 2334 Warfield Way Unit D
- 2346 Warfield Way Unit D
- 2346 Warfield Way Unit C
- 2346 Warfield Way Unit B
- 2346 Warfield Way Unit A
- 2299 Warfield Way Unit D
- 2299 Warfield Way Unit C
- 2299 Warfield Way Unit B
- 2299 Warfield Way Unit A
- 2340 Warfield Way Unit D
Ask me questions while you tour the home.