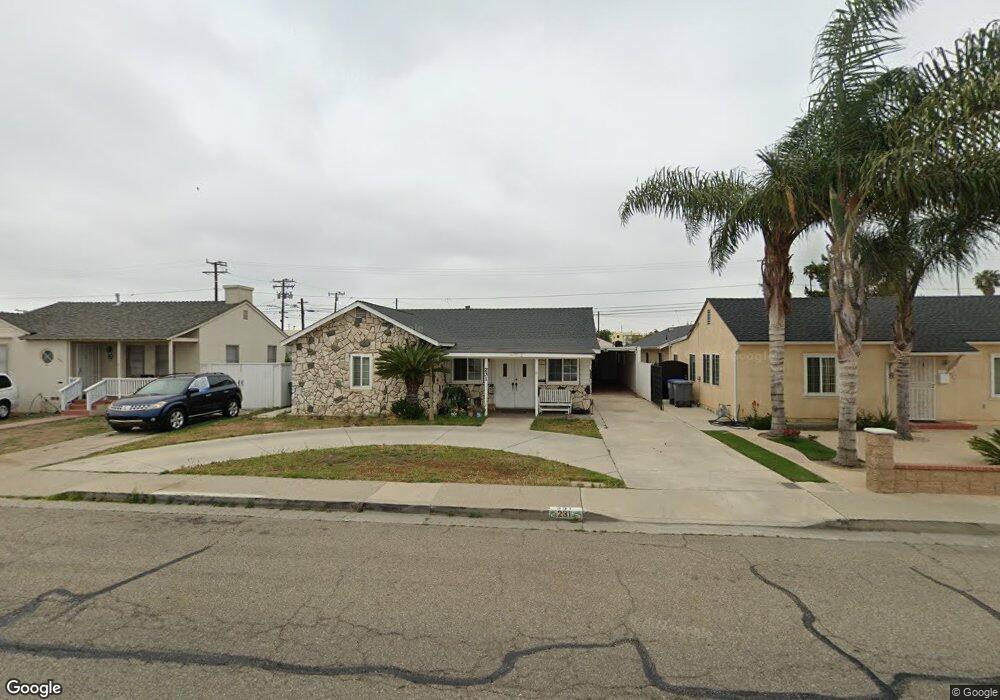
231 E Ash St Oxnard, CA 93033
Cal-Gisler NeighborhoodEstimated Value: $637,000 - $692,000
3
Beds
1
Bath
1,426
Sq Ft
$470/Sq Ft
Est. Value
About This Home
This home is located at 231 E Ash St, Oxnard, CA 93033 and is currently estimated at $670,689, approximately $470 per square foot. 231 E Ash St is a home located in Ventura County with nearby schools including Elm Street Elementary School, R.J. Frank Academy of Marine Science & Engineering, and Santa Clara High School.
Ownership History
Date
Name
Owned For
Owner Type
Purchase Details
Closed on
Mar 1, 2010
Sold by
Benitez Maria Antonia
Bought by
Buenrostro Manuel A and Moraga Rayleen T
Current Estimated Value
Home Financials for this Owner
Home Financials are based on the most recent Mortgage that was taken out on this home.
Original Mortgage
$206,196
Outstanding Balance
$140,165
Interest Rate
5.5%
Mortgage Type
FHA
Estimated Equity
$530,524
Purchase Details
Closed on
Feb 26, 2007
Sold by
Benitez Maria Antonia
Bought by
Benitez Maria Antonia
Home Financials for this Owner
Home Financials are based on the most recent Mortgage that was taken out on this home.
Original Mortgage
$300,000
Interest Rate
8.5%
Mortgage Type
New Conventional
Purchase Details
Closed on
Jan 8, 1998
Sold by
Nungaray Maria R and Nungaray Cecilio
Bought by
Benitez Maria Antonia and Buenrostro Manuel Alehandro
Create a Home Valuation Report for This Property
The Home Valuation Report is an in-depth analysis detailing your home's value as well as a comparison with similar homes in the area
Home Values in the Area
Average Home Value in this Area
Purchase History
| Date | Buyer | Sale Price | Title Company |
|---|---|---|---|
| Buenrostro Manuel A | $210,000 | Chicago Title Company | |
| Benitez Maria Antonia | -- | Pacific Title | |
| Benitez Maria Antonia | -- | -- |
Source: Public Records
Mortgage History
| Date | Status | Borrower | Loan Amount |
|---|---|---|---|
| Open | Buenrostro Manuel A | $206,196 | |
| Previous Owner | Benitez Maria Antonia | $300,000 |
Source: Public Records
Tax History
| Year | Tax Paid | Tax Assessment Tax Assessment Total Assessment is a certain percentage of the fair market value that is determined by local assessors to be the total taxable value of land and additions on the property. | Land | Improvement |
|---|---|---|---|---|
| 2025 | $4,399 | $367,867 | $125,202 | $242,665 |
| 2024 | $4,399 | $360,654 | $122,747 | $237,907 |
| 2023 | $4,238 | $353,583 | $120,340 | $233,243 |
| 2022 | $4,109 | $346,650 | $117,980 | $228,670 |
| 2021 | $4,075 | $339,853 | $115,666 | $224,187 |
| 2020 | $4,150 | $336,370 | $114,481 | $221,889 |
| 2019 | $4,031 | $329,776 | $112,237 | $217,539 |
| 2018 | $3,973 | $323,311 | $110,037 | $213,274 |
| 2017 | $3,770 | $316,973 | $107,880 | $209,093 |
| 2016 | $3,720 | $310,759 | $105,765 | $204,994 |
| 2015 | $3,759 | $306,093 | $104,177 | $201,916 |
| 2014 | $3,718 | $300,099 | $102,138 | $197,961 |
Source: Public Records
Map
Nearby Homes
- 1239 S C St
- 225 W Iris St
- 1127 S C St
- 865 S B St Unit Q1
- 819 S B St Unit 34
- 633 Meta St
- 2024 S J St
- 1030 Ilena St
- 2151 E Wooley Rd
- 550 S G St
- 603 S G St
- 3151 Fournier St
- 3130 Paula St
- 807 Kingfisher Way
- 1174 Oyster Place Unit 15
- 403 E 2nd St
- 136 S Roosevelt Ave
- 1501 Pisco Ln
- 1231 Lost Point Ln
- 1309 Nautical Way
Your Personal Tour Guide
Ask me questions while you tour the home.