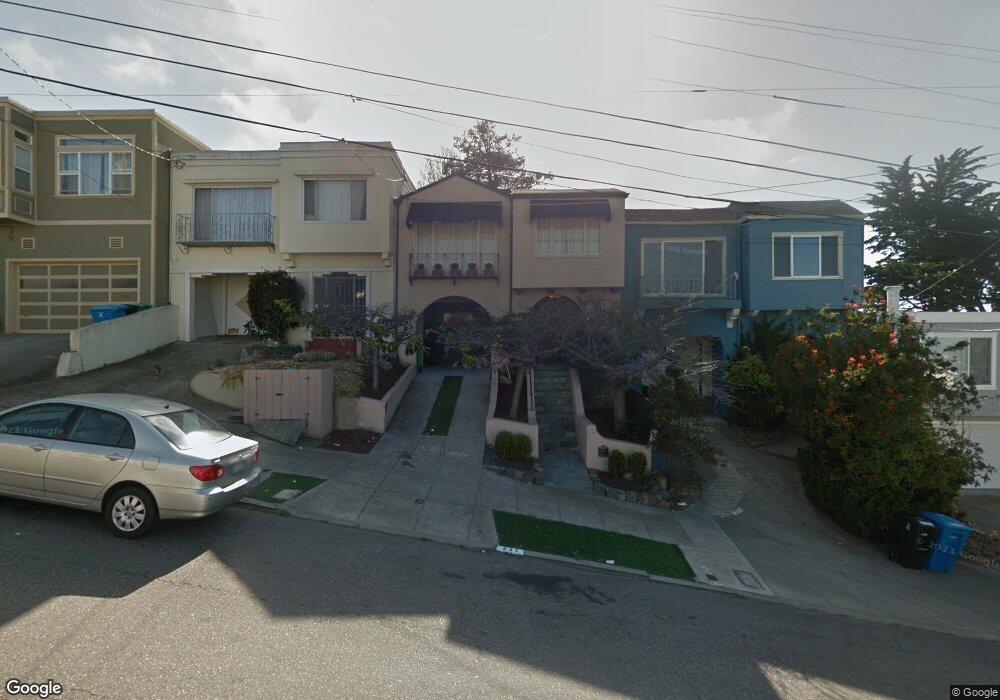
231 Faxon Ave San Francisco, CA 94112
Ingleside NeighborhoodEstimated Value: $908,000 - $1,207,000
2
Beds
1
Bath
1,150
Sq Ft
$867/Sq Ft
Est. Value
About This Home
This home is located at 231 Faxon Ave, San Francisco, CA 94112 and is currently estimated at $996,921, approximately $866 per square foot. 231 Faxon Ave is a home located in San Francisco County with nearby schools including Ortega (Jose) Elementary School, Aptos Middle School, and Leadership High School.
Ownership History
Date
Name
Owned For
Owner Type
Purchase Details
Closed on
Nov 17, 1998
Sold by
Robert Valin
Bought by
Valin Robert and Resch Dean
Current Estimated Value
Purchase Details
Closed on
Mar 20, 1996
Sold by
Stephenson Tod E
Bought by
Valin Robert
Home Financials for this Owner
Home Financials are based on the most recent Mortgage that was taken out on this home.
Original Mortgage
$200,000
Interest Rate
7.8%
Create a Home Valuation Report for This Property
The Home Valuation Report is an in-depth analysis detailing your home's value as well as a comparison with similar homes in the area
Home Values in the Area
Average Home Value in this Area
Purchase History
| Date | Buyer | Sale Price | Title Company |
|---|---|---|---|
| Valin Robert | -- | Fidelity National Title Co | |
| Valin Robert | -- | Fidelity National Title Ins |
Source: Public Records
Mortgage History
| Date | Status | Borrower | Loan Amount |
|---|---|---|---|
| Previous Owner | Valin Robert | $200,000 |
Source: Public Records
Tax History Compared to Growth
Tax History
| Year | Tax Paid | Tax Assessment Tax Assessment Total Assessment is a certain percentage of the fair market value that is determined by local assessors to be the total taxable value of land and additions on the property. | Land | Improvement |
|---|---|---|---|---|
| 2025 | $5,450 | $405,803 | $225,447 | $180,356 |
| 2024 | $5,450 | $397,847 | $221,027 | $176,820 |
| 2023 | $5,359 | $390,047 | $216,694 | $173,353 |
| 2022 | $5,244 | $382,400 | $212,446 | $169,954 |
| 2021 | $5,147 | $374,903 | $208,281 | $166,622 |
| 2020 | $5,521 | $371,060 | $206,146 | $164,914 |
| 2019 | $5,064 | $363,785 | $202,104 | $161,681 |
| 2018 | $5,197 | $356,653 | $198,142 | $158,511 |
| 2017 | $4,536 | $349,660 | $194,257 | $155,403 |
| 2016 | $4,434 | $342,805 | $190,449 | $152,356 |
| 2015 | $4,375 | $337,657 | $187,589 | $150,068 |
| 2014 | $4,262 | $331,044 | $183,915 | $147,129 |
Source: Public Records
Map
Nearby Homes
- 914 Capitol Ave
- 946 Capitol Ave
- 20 Sargent St
- 224 Shields St
- 475 Head St
- 233 Sargent St
- 34 Brighton Ave
- 324 Holloway Ave
- 451 Ramsell St
- 424 Garfield St
- 275 Miramar Ave
- 271 Granada Ave
- 63 Minerva St
- 5000 Summit St
- 337 Jules Ave
- 501 Sargent St
- 106 Broad St
- 171 Margaret Ave
- 621 Shields St
- 230 Ralston St