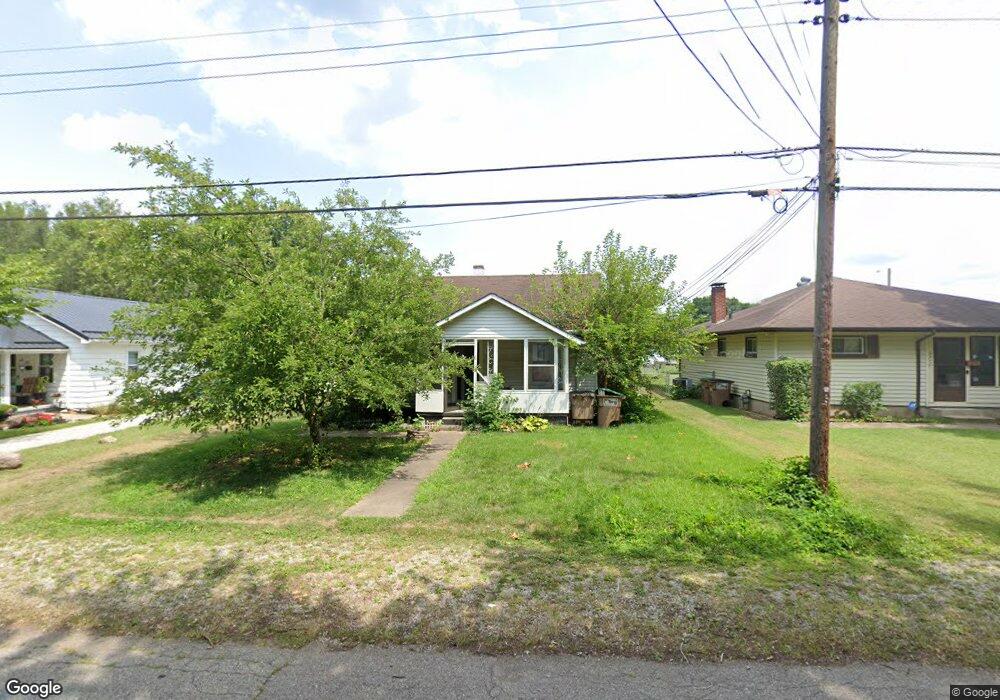
231 N Cherry St Columbus, IN 47201
Estimated Value: $81,000 - $171,000
2
Beds
1
Bath
816
Sq Ft
$161/Sq Ft
Est. Value
About This Home
This home is located at 231 N Cherry St, Columbus, IN 47201 and is currently estimated at $131,331, approximately $160 per square foot. 231 N Cherry St is a home located in Bartholomew County with nearby schools including Clifty Creek Elementary School, Central Middle School, and Columbus East High School.
Ownership History
Date
Name
Owned For
Owner Type
Purchase Details
Closed on
Nov 7, 2024
Sold by
Eagleton Ruby L
Bought by
Proffitt William D
Current Estimated Value
Purchase Details
Closed on
Mar 5, 2013
Sold by
Shawler Estate
Bought by
Ruby L Eagleton
Purchase Details
Closed on
Jun 15, 2004
Sold by
Rooks Chester L
Bought by
Wells Fargo Bank National Assoc
Purchase Details
Closed on
Jun 12, 2002
Sold by
Danny Pope
Bought by
Rooks Chester L
Create a Home Valuation Report for This Property
The Home Valuation Report is an in-depth analysis detailing your home's value as well as a comparison with similar homes in the area
Home Values in the Area
Average Home Value in this Area
Purchase History
| Date | Buyer | Sale Price | Title Company |
|---|---|---|---|
| Proffitt William D | $50,000 | Security Title Services | |
| Ruby L Eagleton | $46,716 | Meridian Title Corporation | |
| Hughes Shawler Glenn | $46,716 | -- | |
| Ruby L | $46,716 | Meridian Title Corporation | |
| Wells Fargo Bank National Assoc | -- | -- | |
| Rooks Chester L | -- | -- |
Source: Public Records
Tax History Compared to Growth
Tax History
| Year | Tax Paid | Tax Assessment Tax Assessment Total Assessment is a certain percentage of the fair market value that is determined by local assessors to be the total taxable value of land and additions on the property. | Land | Improvement |
|---|---|---|---|---|
| 2024 | $2,031 | $90,300 | $18,100 | $72,200 |
| 2023 | $2,305 | $101,500 | $21,900 | $79,600 |
| 2022 | $2,110 | $93,200 | $21,900 | $71,300 |
| 2021 | $1,718 | $75,200 | $11,300 | $63,900 |
| 2020 | $1,398 | $61,300 | $11,300 | $50,000 |
| 2019 | $1,175 | $55,100 | $11,300 | $43,800 |
| 2018 | $1,397 | $55,100 | $11,300 | $43,800 |
| 2017 | $1,200 | $55,100 | $10,900 | $44,200 |
| 2016 | $1,166 | $53,400 | $10,900 | $42,500 |
| 2014 | $1,138 | $51,200 | $10,900 | $40,300 |
Source: Public Records
Map
Nearby Homes
- 41 N Cherry St
- 2263 Wallace Ave
- 2041 Mckinley Ave
- 507 N Cherry St
- 2032 Indiana Ave
- 41 N Ross St
- 2651 Clifty St
- 661 Smith St
- 51 S Brooks St
- 213 Hege Ave
- 758 N Cherry St
- 52 N Hinman St
- 212 S Beatty St
- 2035 10th St
- 1521 Indiana Ave
- 342 Jones St
- 620 Hutchins Ave
- 1631 Kentucky Ave
- 2905 Kentucky Ave
- 813 Cottage Ave