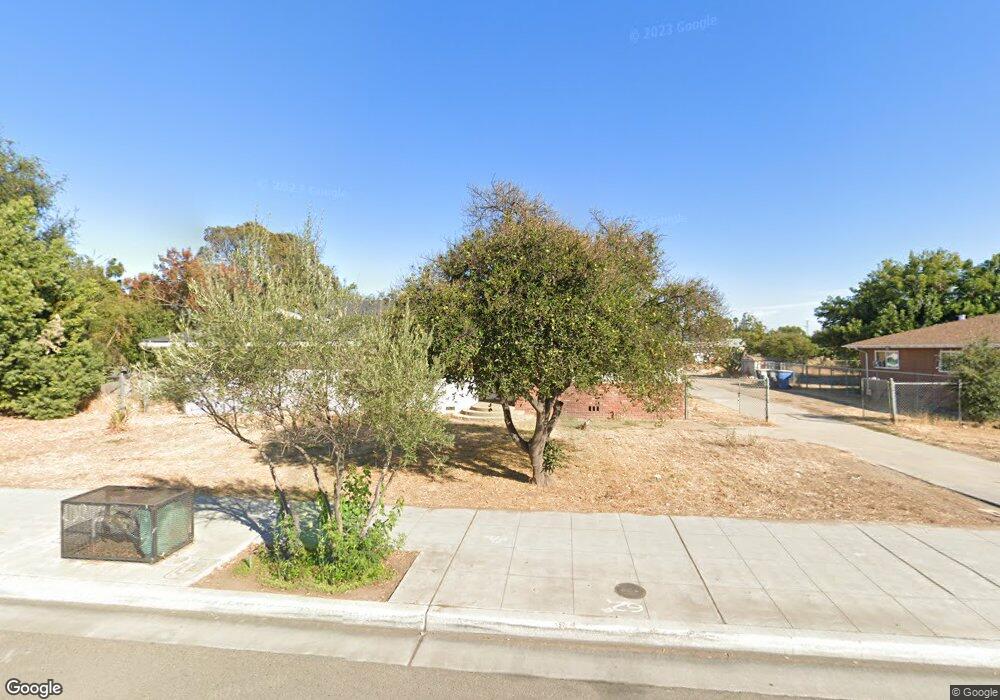
231 S Peach Ave Fresno, CA 93727
Sunnyside NeighborhoodEstimated Value: $480,000 - $616,000
3
Beds
3
Baths
1,988
Sq Ft
$271/Sq Ft
Est. Value
About This Home
This home is located at 231 S Peach Ave, Fresno, CA 93727 and is currently estimated at $538,358, approximately $270 per square foot. 231 S Peach Ave is a home located in Fresno County with nearby schools including Easterby Elementary School, Kings Canyon Middle School, and Sunnyside High School.
Ownership History
Date
Name
Owned For
Owner Type
Purchase Details
Closed on
Jan 18, 2022
Sold by
Yang Moua and Yang Zoua
Bought by
Vang Shang
Current Estimated Value
Home Financials for this Owner
Home Financials are based on the most recent Mortgage that was taken out on this home.
Original Mortgage
$427,500
Outstanding Balance
$394,558
Interest Rate
3.22%
Mortgage Type
New Conventional
Estimated Equity
$143,800
Purchase Details
Closed on
Nov 1, 2010
Sold by
Moua Christine Vang
Bought by
Moua Yia
Create a Home Valuation Report for This Property
The Home Valuation Report is an in-depth analysis detailing your home's value as well as a comparison with similar homes in the area
Home Values in the Area
Average Home Value in this Area
Purchase History
| Date | Buyer | Sale Price | Title Company |
|---|---|---|---|
| Vang Shang | $450,000 | Placer Title | |
| Moua Yia | -- | None Available | |
| Moua Jerry | -- | None Available |
Source: Public Records
Mortgage History
| Date | Status | Borrower | Loan Amount |
|---|---|---|---|
| Open | Vang Shang | $427,500 |
Source: Public Records
Tax History Compared to Growth
Tax History
| Year | Tax Paid | Tax Assessment Tax Assessment Total Assessment is a certain percentage of the fair market value that is determined by local assessors to be the total taxable value of land and additions on the property. | Land | Improvement |
|---|---|---|---|---|
| 2025 | $6,083 | $477,542 | $238,771 | $238,771 |
| 2023 | $5,964 | $459,000 | $229,500 | $229,500 |
| 2022 | $3,465 | $260,902 | $88,317 | $172,585 |
| 2021 | $3,369 | $255,787 | $86,586 | $169,201 |
| 2020 | $3,352 | $253,166 | $85,699 | $167,467 |
| 2019 | $3,223 | $248,203 | $84,019 | $164,184 |
| 2018 | $3,152 | $243,337 | $82,372 | $160,965 |
| 2017 | $3,097 | $238,566 | $80,757 | $157,809 |
| 2016 | $2,984 | $233,889 | $79,174 | $154,715 |
| 2015 | $2,785 | $217,800 | $74,800 | $143,000 |
| 2014 | $2,615 | $204,000 | $70,100 | $133,900 |
Source: Public Records
Map
Nearby Homes
- 5160 E Balch Ave
- 5407 E Tulare St
- 5145 E Lane Ave Unit 252
- 851 N Filbert Ave
- 342 N Minnewawa Ave
- 5023 E Lane Ave
- 1234 Address Unavailable
- 4918 E Illinois Ave
- 5490 E 9 Ave
- 4983 E Grant Ave
- 742 S Park Circle Dr
- 5221 E Townsend Ave
- 4923 E Grant Ave
- 5238 E Townsend Ave
- 5527 E Grant Ave
- 930 S Park Circle Dr
- 4985 E Butler Ave Unit 109
- 4975 E Butler Ave Unit 131
- 935 S Park Circle Dr
- 5026 E Lewis Ave
- 241 S Peach Ave
- 217 S Peach Ave
- 317 S Peach Ave
- 228 S Peach Ave
- 161 S Peach Ave
- 260 S Peach Ave
- 174 S Peach Ave
- 337 S Peach Ave
- 154 S Peach Ave
- 145 S Peach Ave
- 144 S Peach Ave
- 144 S Peach Ave
- 133 S Peach Ave
- 158 S Peach Ave
- 312 S Bush Ave
- 5244 E Tulare St Unit 116
- 5244 E Tulare St Unit 117
- 5244 E Tulare St Unit 118
- 5244 E Tulare St Unit 119
- 5244 E Tulare St Unit 120