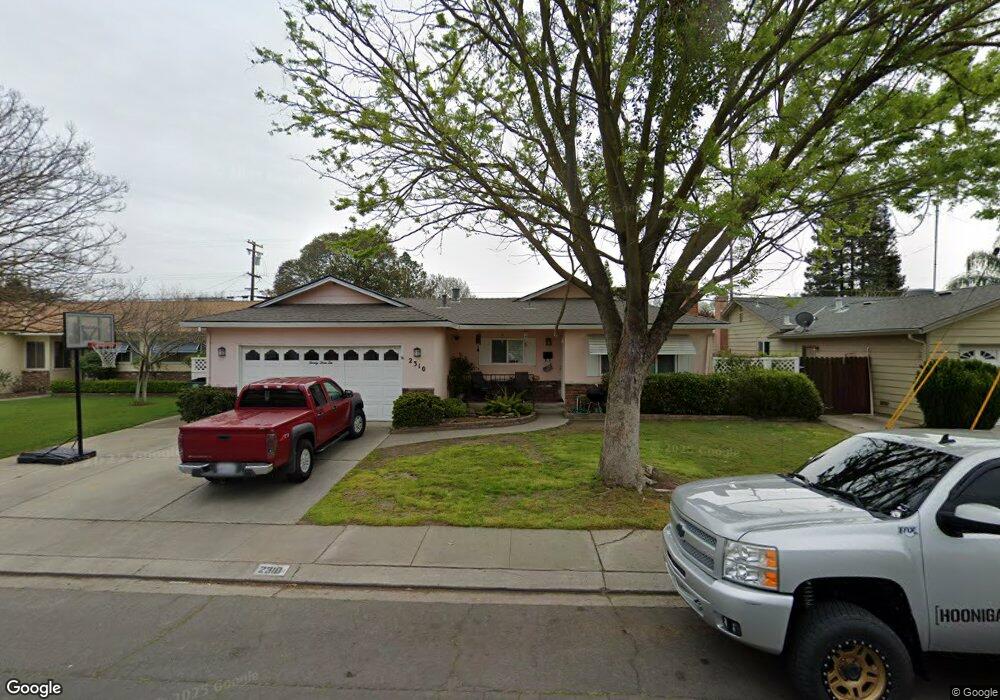
2310 Codding Dr Modesto, CA 95350
Central Modesto NeighborhoodEstimated Value: $315,000 - $449,000
3
Beds
2
Baths
1,502
Sq Ft
$268/Sq Ft
Est. Value
About This Home
This home is located at 2310 Codding Dr, Modesto, CA 95350 and is currently estimated at $402,487, approximately $267 per square foot. 2310 Codding Dr is a home located in Stanislaus County with nearby schools including Standiford Elementary School, Somerset Middle School, and Fred C. Beyer High School.
Ownership History
Date
Name
Owned For
Owner Type
Purchase Details
Closed on
May 23, 2018
Sold by
Phillips David J and Phillips David James
Bought by
Phillips David J and Phillips Betty C
Current Estimated Value
Purchase Details
Closed on
Jan 14, 2015
Sold by
Bernhard Deborah Lee
Bought by
The Bernhard Family Trust
Purchase Details
Closed on
Dec 4, 2014
Sold by
Phillips Richard J and Phillips Christine I
Bought by
Phillips Richard J and Phillips Christine I
Purchase Details
Closed on
Aug 18, 2014
Sold by
Phillips James Mitchell
Bought by
Phillips Richard John and Phillips David James
Purchase Details
Closed on
Jan 29, 2010
Sold by
Phillips James Mitchell and The Phillips Family Trust
Bought by
Lee Phillips James Mitchell and Lee Bernhard Deborah
Purchase Details
Closed on
Aug 29, 2002
Sold by
Lee Phillips James Mitchell and Lee Bernhard Deborah
Bought by
Phillips James Mitchell
Create a Home Valuation Report for This Property
The Home Valuation Report is an in-depth analysis detailing your home's value as well as a comparison with similar homes in the area
Home Values in the Area
Average Home Value in this Area
Purchase History
| Date | Buyer | Sale Price | Title Company |
|---|---|---|---|
| Phillips David J | -- | None Available | |
| The Bernhard Family Trust | -- | None Available | |
| Phillips Richard J | -- | None Available | |
| Phillips Richard J | -- | None Available | |
| Phillips Richard John | -- | None Available | |
| Lee Phillips James Mitchell | -- | None Available | |
| Phillips James Mitchell | -- | None Available |
Source: Public Records
Tax History Compared to Growth
Tax History
| Year | Tax Paid | Tax Assessment Tax Assessment Total Assessment is a certain percentage of the fair market value that is determined by local assessors to be the total taxable value of land and additions on the property. | Land | Improvement |
|---|---|---|---|---|
| 2025 | $868 | $78,551 | $15,073 | $63,478 |
| 2024 | $852 | $77,012 | $14,778 | $62,234 |
| 2023 | $836 | $75,503 | $14,489 | $61,014 |
| 2022 | $802 | $74,023 | $14,205 | $59,818 |
| 2021 | $788 | $72,573 | $13,927 | $58,646 |
| 2020 | $777 | $71,830 | $13,785 | $58,045 |
| 2019 | $763 | $70,422 | $13,515 | $56,907 |
| 2018 | $748 | $69,042 | $13,250 | $55,792 |
| 2017 | $730 | $67,690 | $12,991 | $54,699 |
| 2016 | $726 | $66,364 | $12,737 | $53,627 |
| 2015 | $715 | $65,368 | $12,546 | $52,822 |
| 2014 | -- | $64,089 | $12,301 | $51,788 |
Source: Public Records
Map
Nearby Homes
- 161 Ribier Ave
- 1912 Valle Vista Ave
- 2409 Newport Dr
- 809 Carrigan Ave
- 1005 Pasadena Ln
- 2109 Bodega Ln
- 230 W Rumble Rd Unit B
- 2013 Sherwood Ave
- 1921 Sherwood Ave
- 2768 Sherwood Ave Unit B
- 405 Roxbury Ln
- 404 Andover Ln
- 1177 Norwegian Ave Unit 46
- 1535 Melrose Ave
- 1122 Huntington Dr
- 1936 Ralston Ct
- 2104 La Veta Ct
- 2517 Fremont Ave
- 1444 Casa Blanca Ct
- 516 Barringham Ln
- 2314 Codding Dr
- 2306 Codding Dr
- 2301 Jasmin Ave
- 2305 Jasmin Ave
- 2318 Codding Dr
- 2302 Codding Dr
- 2217 Jasmin Ave
- 2313 Codding Dr
- 2309 Jasmin Ave
- 2301 Codding Dr
- 2400 Codding Dr
- 2214 Codding Dr
- 2213 Jasmin Ave
- 2313 Jasmin Ave
- 221 Dove Ct
- 224 Dove Ct
- 2401 Codding Dr
- 2213 Codding Dr
- 315 Ryan Ave
- 2210 Codding Dr