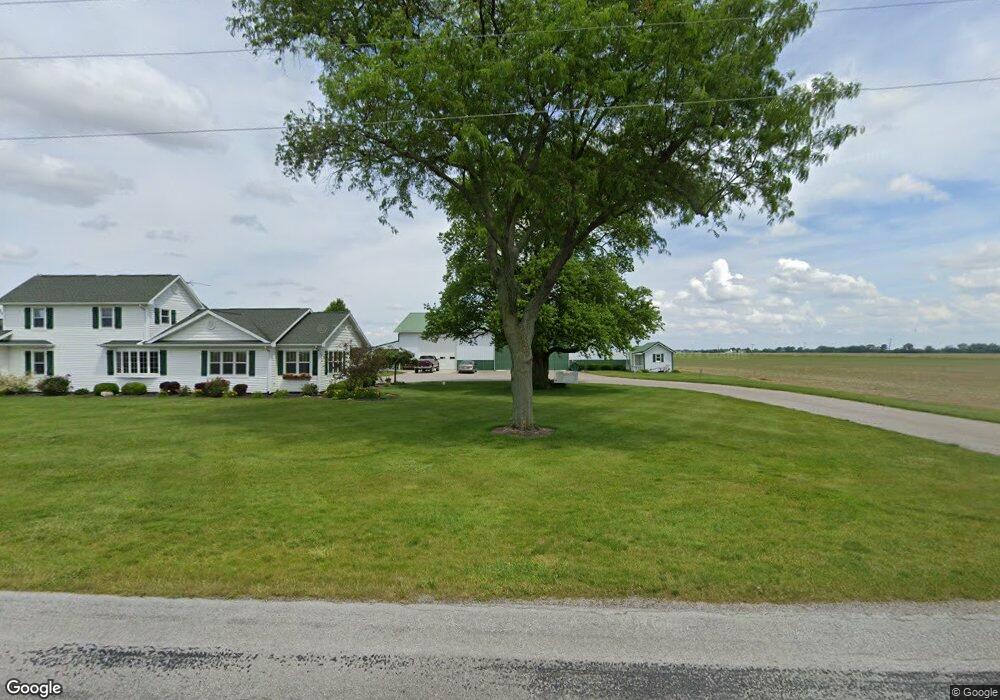
23114 Mermill Rd Custar, OH 43511
Estimated Value: $251,326 - $308,000
3
Beds
1
Bath
2,440
Sq Ft
$113/Sq Ft
Est. Value
About This Home
This home is located at 23114 Mermill Rd, Custar, OH 43511 and is currently estimated at $276,832, approximately $113 per square foot. 23114 Mermill Rd is a home located in Wood County with nearby schools including Bowling Green High School.
Ownership History
Date
Name
Owned For
Owner Type
Purchase Details
Closed on
Aug 29, 2024
Sold by
Fintel Timothy R and Fintel Andrea L
Bought by
Andrea L Fintel Revocable Trust and Fintel
Current Estimated Value
Purchase Details
Closed on
Jul 17, 2009
Sold by
Fintel Timothy R and Fintel Andrea
Bought by
Gebers James D and Gebers Mary Ann
Purchase Details
Closed on
Jul 1, 2009
Sold by
Sunderman John D
Bought by
Fintel Timothy R
Purchase Details
Closed on
Mar 24, 2006
Sold by
Fintel Timothy R and Fintel Andrea L
Bought by
Burton Julie A
Create a Home Valuation Report for This Property
The Home Valuation Report is an in-depth analysis detailing your home's value as well as a comparison with similar homes in the area
Purchase History
| Date | Buyer | Sale Price | Title Company |
|---|---|---|---|
| Andrea L Fintel Revocable Trust | -- | None Listed On Document | |
| Gebers James D | -- | Attorney | |
| Sunderman John D | -- | Attorney | |
| Fintel Timothy R | -- | Attorney | |
| Burton Julie A | -- | None Available |
Source: Public Records
Tax History
| Year | Tax Paid | Tax Assessment Tax Assessment Total Assessment is a certain percentage of the fair market value that is determined by local assessors to be the total taxable value of land and additions on the property. | Land | Improvement |
|---|---|---|---|---|
| 2025 | $3,183 | $78,085 | $12,950 | $65,135 |
| 2024 | $3,166 | $78,085 | $12,950 | $65,135 |
| 2023 | $3,166 | $78,090 | $12,950 | $65,140 |
| 2021 | $2,770 | $67,380 | $10,920 | $56,460 |
| 2020 | $2,698 | $67,380 | $10,920 | $56,460 |
| 2019 | $2,400 | $56,640 | $9,980 | $46,660 |
| 2018 | $2,386 | $56,640 | $9,980 | $46,660 |
| 2017 | $2,356 | $56,640 | $9,980 | $46,660 |
| 2016 | $2,099 | $49,670 | $7,560 | $42,110 |
| 2015 | $2,099 | $49,670 | $7,560 | $42,110 |
| 2014 | $2,214 | $49,670 | $7,560 | $42,110 |
| 2013 | $2,409 | $48,870 | $6,760 | $42,110 |
Source: Public Records
Map
Nearby Homes
- 8931 France Ave
- 22759 Defiance Pike
- 1463 Ohio 281
- 20750 Taylor St
- 20280 Locust St
- 13439 Ash St
- 20175 Taylor St
- 13270 Maple St
- 13375 Silver St
- 24642 Hammansburg Rd Unit 309-0700
- 117 Meadow Ln
- 115 Meadow Ln
- 113 N Meadow Ln
- 116 Meadow Ln
- 119 N Harvest St
- 112 N Harvest Dr
- 121 N Harvest St
- 118 N Harvest Dr
- 120 N Harvest Dr
- 102 N Harvest Dr
- 22862 Mermill Rd
- 23368 Mermill Rd
- 9876 Custar Rd
- 9677 Custar Rd
- 9795 Custar Rd
- 22375 Mermill Rd
- 23505 Mermill Rd
- 23505 Mermill Rd
- 23572 Mermill Rd
- 10509 Custar Rd
- 22190 Mermill Rd
- 22573 Mermill Rd
- 22550 Mermill Rd
- 9465 Custar Rd
- 22460 Defiance St
- 22460 Mermill Rd
- 10662 Custar Rd
- 22465 Defiance St
- 22430 Mermill Rd
- 10687 Custar Rd
Your Personal Tour Guide
Ask me questions while you tour the home.