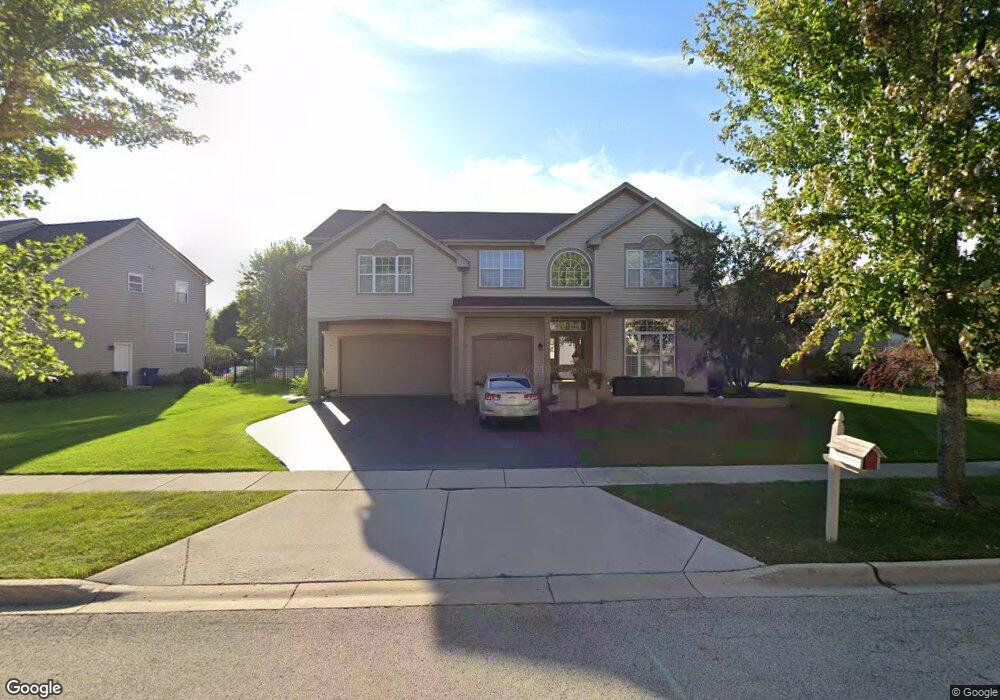
2312 Loop Rd Algonquin, IL 60102
Estimated Value: $519,521 - $580,000
4
Beds
--
Bath
3,264
Sq Ft
$171/Sq Ft
Est. Value
About This Home
This home is located at 2312 Loop Rd, Algonquin, IL 60102 and is currently estimated at $558,630, approximately $171 per square foot. 2312 Loop Rd is a home located in Kane County with nearby schools including Westfield Community School and Harry D Jacobs High School.
Ownership History
Date
Name
Owned For
Owner Type
Purchase Details
Closed on
Mar 13, 2012
Sold by
Markowski Scott J and Markowski Barbara K
Bought by
Albrecht Scott J and Albrecht Barbara K
Current Estimated Value
Home Financials for this Owner
Home Financials are based on the most recent Mortgage that was taken out on this home.
Original Mortgage
$206,000
Outstanding Balance
$141,575
Interest Rate
3.88%
Mortgage Type
New Conventional
Estimated Equity
$417,055
Purchase Details
Closed on
May 31, 2000
Sold by
Willoughby Farms Third New Dimension Ltd
Bought by
Markowski Scott J and Albrecht Barbara K
Home Financials for this Owner
Home Financials are based on the most recent Mortgage that was taken out on this home.
Original Mortgage
$257,550
Interest Rate
7.75%
Create a Home Valuation Report for This Property
The Home Valuation Report is an in-depth analysis detailing your home's value as well as a comparison with similar homes in the area
Purchase History
| Date | Buyer | Sale Price | Title Company |
|---|---|---|---|
| Albrecht Scott J | -- | Acqt | |
| Markowski Scott J | $302,500 | Stewart Title Company |
Source: Public Records
Mortgage History
| Date | Status | Borrower | Loan Amount |
|---|---|---|---|
| Open | Albrecht Scott J | $206,000 | |
| Previous Owner | Markowski Scott J | $257,550 |
Source: Public Records
Tax History
| Year | Tax Paid | Tax Assessment Tax Assessment Total Assessment is a certain percentage of the fair market value that is determined by local assessors to be the total taxable value of land and additions on the property. | Land | Improvement |
|---|---|---|---|---|
| 2024 | $10,759 | $150,063 | $25,730 | $124,333 |
| 2023 | $10,221 | $135,022 | $23,151 | $111,871 |
| 2022 | $10,290 | $130,915 | $23,151 | $107,764 |
| 2021 | $9,982 | $123,610 | $21,859 | $101,751 |
| 2020 | $9,782 | $120,831 | $21,368 | $99,463 |
| 2019 | $9,483 | $114,706 | $20,285 | $94,421 |
| 2018 | $9,549 | $112,434 | $19,883 | $92,551 |
| 2017 | $9,154 | $105,177 | $18,600 | $86,577 |
| 2016 | $9,514 | $103,193 | $18,009 | $85,184 |
| 2015 | -- | $94,354 | $17,040 | $77,314 |
| 2014 | -- | $87,697 | $16,569 | $71,128 |
| 2013 | -- | $90,381 | $17,076 | $73,305 |
Source: Public Records
Map
Nearby Homes
- 2258 Stonegate Rd
- 1101 Waterford St
- 1121 Waterford St
- 1020 Glenmont St
- 1090 Glenmont St
- 1247 Glenmont St
- 1111 Glenmont St
- 1243 Glenmont St
- 1080 Glenmont St
- 1249 Glenmont St
- 1245 Glenmont St
- 2313 Barrett Dr
- 120 Newburgh Ln
- 1262 Glenmont St
- 2254 Stonegate Rd
- 1256 Glenmont St
- 1254 Glenmont St
- 150 Newburgh Ln
- 2248 Stonegate Rd
- 1250 Glenmont St
- 2313 Stonegate Rd Unit 4
- 2320 Loop Rd
- 2315 Stonegate Rd
- 2304 Loop Rd
- 2311 Loop Rd
- 2309 Loop Rd Unit 4
- 2313 Loop Rd
- 2305 Loop Rd
- 2307 Loop Rd
- 2324 Loop Rd
- 2315 Loop Rd
- 2303 Loop Rd
- 2317 Loop Rd
- 2319 Loop Rd
- 2316 Poets Ln
- 2320 Poets Ln
- 2312 Poets Ln
- 2328 Sandy Creek Dr Unit 241
- 2328 Sandy Creek Dr Unit 2332
- 2321 Loop Rd
Your Personal Tour Guide
Ask me questions while you tour the home.