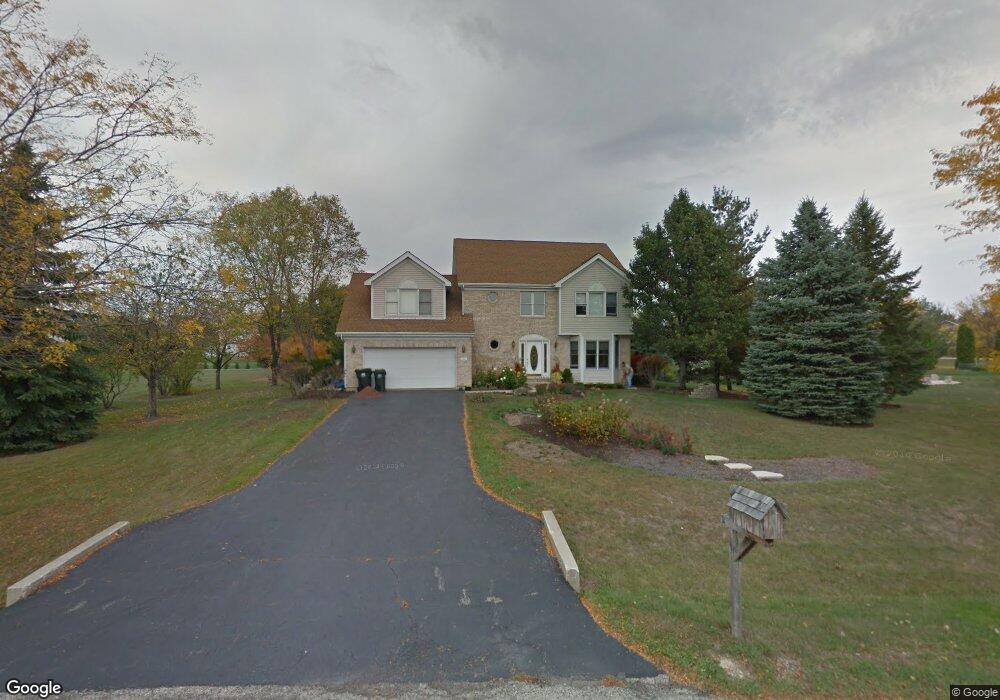
2312 Pine Crest Ct Spring Grove, IL 60081
Estimated Value: $428,000 - $509,000
4
Beds
3
Baths
2,860
Sq Ft
$163/Sq Ft
Est. Value
About This Home
This home is located at 2312 Pine Crest Ct, Spring Grove, IL 60081 and is currently estimated at $466,054, approximately $162 per square foot. 2312 Pine Crest Ct is a home located in McHenry County with nearby schools including Spring Grove Elementary School, Nippersink Middle School, and Richmond-Burton High School.
Ownership History
Date
Name
Owned For
Owner Type
Purchase Details
Closed on
Jul 20, 2011
Sold by
Henning Thomas and Henning Sherry
Bought by
Rodriguez Francisco and Rodriguez Lynette K
Current Estimated Value
Home Financials for this Owner
Home Financials are based on the most recent Mortgage that was taken out on this home.
Original Mortgage
$178,400
Outstanding Balance
$122,792
Interest Rate
4.52%
Mortgage Type
New Conventional
Estimated Equity
$343,262
Purchase Details
Closed on
Jun 14, 1994
Sold by
Parkway Bank & Trust Company
Bought by
Henning Thomas and Henning Sherry
Home Financials for this Owner
Home Financials are based on the most recent Mortgage that was taken out on this home.
Original Mortgage
$150,000
Interest Rate
8.78%
Purchase Details
Closed on
Feb 11, 1994
Sold by
Parkway Bank & Trust Company
Bought by
Parkway Bank & Trust Company
Create a Home Valuation Report for This Property
The Home Valuation Report is an in-depth analysis detailing your home's value as well as a comparison with similar homes in the area
Home Values in the Area
Average Home Value in this Area
Purchase History
| Date | Buyer | Sale Price | Title Company |
|---|---|---|---|
| Rodriguez Francisco | $223,000 | Fidelity Natl Title | |
| Henning Thomas | $209,000 | Chicago Title | |
| Parkway Bank & Trust Company | $28,000 | Chicago Title Insurance Co |
Source: Public Records
Mortgage History
| Date | Status | Borrower | Loan Amount |
|---|---|---|---|
| Open | Rodriguez Francisco | $178,400 | |
| Previous Owner | Henning Thomas | $150,000 |
Source: Public Records
Tax History Compared to Growth
Tax History
| Year | Tax Paid | Tax Assessment Tax Assessment Total Assessment is a certain percentage of the fair market value that is determined by local assessors to be the total taxable value of land and additions on the property. | Land | Improvement |
|---|---|---|---|---|
| 2024 | $8,970 | $125,290 | $24,484 | $100,806 |
| 2023 | $8,713 | $114,535 | $22,382 | $92,153 |
| 2022 | $8,413 | $103,129 | $20,153 | $82,976 |
| 2021 | $7,658 | $93,426 | $19,343 | $74,083 |
| 2020 | $7,534 | $89,894 | $18,612 | $71,282 |
| 2019 | $7,446 | $87,005 | $18,014 | $68,991 |
| 2018 | $7,383 | $82,113 | $17,270 | $64,843 |
| 2017 | $7,379 | $78,195 | $16,446 | $61,749 |
| 2016 | $7,259 | $73,312 | $15,419 | $57,893 |
| 2013 | -- | $66,710 | $14,579 | $52,131 |
Source: Public Records
Map
Nearby Homes
- 9436 Bellaire Ln
- 8720 Galleria Ct
- 8207 Squirrel Dr
- 9510 Martin Dr
- 2214 Main Street Rd
- 1914 Spring Dale Dr
- 2102 W Hunters Ln
- 10201 Fox Bluff Ln
- Lot 65 & 66 Main Street Rd
- 2150 U S 12
- 8789 Bentley Ln
- 2303 Fox Bluff Ln
- LOT 9 Mayo Ct
- 7416 Briar Ct
- 3013 N Us Highway 12
- 1992 Red Oak Ln
- 8501 Country Shire Ln
- 3012 Rolling Oaks Rd
- Lot 61 Beverly Way
- Lot 57 Beverly Way
- 2415 Pine Crest Ct
- 2404 Pine Crest Ct
- 8915 Hidden Trail
- 2311 N Hidden Trail
- 2317 N Hidden Trail
- 2305 N Hidden Trail
- 2410 Pine Crest Ct
- 2409 N Hidden Trail
- 2317 Pine Crest Ct
- 2311 Pine Crest Ct
- 2403 Pine Crest Ct
- 2415 N Hidden Trail
- 8914 Hidden Trail
- 8909 Hidden Trail
- 2309 Hidden Trail Ct
- 2416 Pine Crest Ct
- 2409 Pine Crest Ct
- 2410 N Hidden Trail
- 2308 S Hidden Trail
- 2302 Hidden Trail