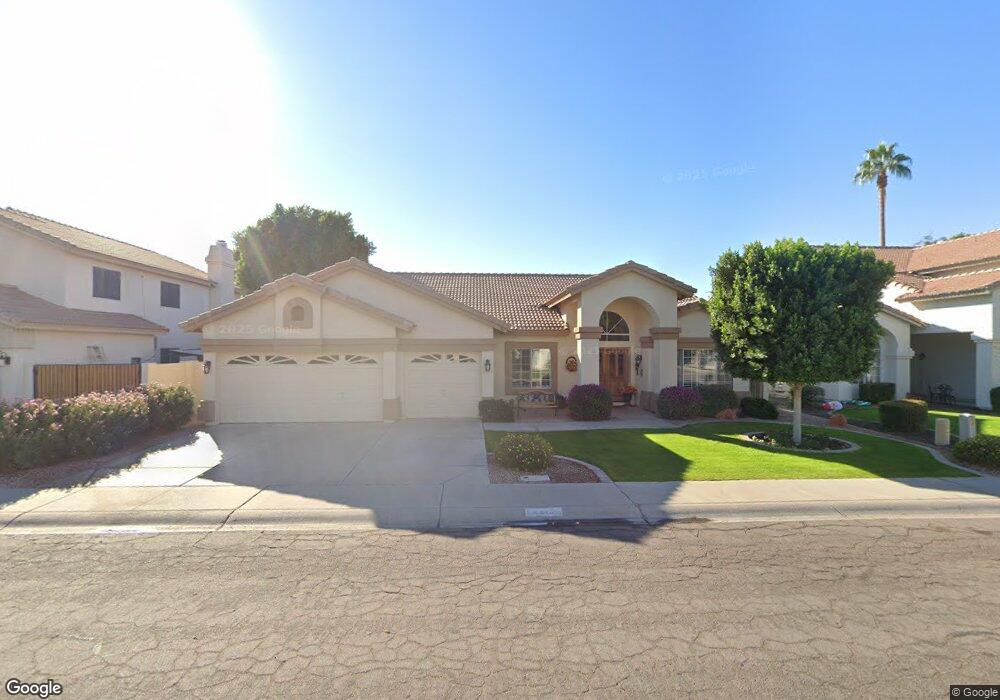
2313 E Beachcomber Dr Gilbert, AZ 85234
Val Vista NeighborhoodEstimated Value: $587,668 - $724,000
Studio
4
Baths
2,418
Sq Ft
$278/Sq Ft
Est. Value
About This Home
This home is located at 2313 E Beachcomber Dr, Gilbert, AZ 85234 and is currently estimated at $672,417, approximately $278 per square foot. 2313 E Beachcomber Dr is a home located in Maricopa County with nearby schools including Val Vista Lakes Elementary School, Greenfield Junior High School, and Gilbert Arts Academy.
Ownership History
Date
Name
Owned For
Owner Type
Purchase Details
Closed on
Dec 9, 2020
Sold by
Geisenhoff Richard K and Geisenhoff Mary A
Bought by
Geisenhoff Richard K and Geisenhoff Mary A
Current Estimated Value
Purchase Details
Closed on
Feb 4, 1998
Sold by
Carter Charles D and Carter Virginia A
Bought by
Geisenhoff Richard K and Geisenhoff Mary A
Home Financials for this Owner
Home Financials are based on the most recent Mortgage that was taken out on this home.
Original Mortgage
$161,500
Interest Rate
6.9%
Mortgage Type
New Conventional
Create a Home Valuation Report for This Property
The Home Valuation Report is an in-depth analysis detailing your home's value as well as a comparison with similar homes in the area
Home Values in the Area
Average Home Value in this Area
Purchase History
| Date | Buyer | Sale Price | Title Company |
|---|---|---|---|
| Geisenhoff Richard K | -- | Pioneer Title | |
| Geisenhoff Richard K | $170,000 | First American Title |
Source: Public Records
Mortgage History
| Date | Status | Borrower | Loan Amount |
|---|---|---|---|
| Previous Owner | Geisenhoff Richard K | $161,500 |
Source: Public Records
Tax History
| Year | Tax Paid | Tax Assessment Tax Assessment Total Assessment is a certain percentage of the fair market value that is determined by local assessors to be the total taxable value of land and additions on the property. | Land | Improvement |
|---|---|---|---|---|
| 2025 | $2,694 | $35,652 | -- | -- |
| 2024 | $2,611 | $33,954 | -- | -- |
| 2023 | $2,611 | $45,680 | $9,130 | $36,550 |
| 2022 | $2,533 | $34,850 | $6,970 | $27,880 |
| 2021 | $2,675 | $33,050 | $6,610 | $26,440 |
| 2020 | $2,633 | $29,880 | $5,970 | $23,910 |
| 2019 | $2,421 | $28,920 | $5,780 | $23,140 |
| 2018 | $2,349 | $27,320 | $5,460 | $21,860 |
| 2017 | $2,269 | $26,660 | $5,330 | $21,330 |
| 2016 | $2,339 | $26,110 | $5,220 | $20,890 |
| 2015 | $2,141 | $24,660 | $4,930 | $19,730 |
Source: Public Records
Map
Nearby Homes
- 2301 E Millbrae Ct
- 1156 N Jamaica Way
- 2255 E Santa Rosa Dr
- 2136 E Freeport Ln
- 1405 N Jamaica Way
- 1064 N Portland Ave
- 2011 E Clipper Ln
- 1912 E Schooner Ct
- 1133 N Peppertree Dr
- 1220 N Crystal Shores
- 1925 E Bay Tree Ct
- 4121 E Valley Auto Dr Unit 109
- 1819 E Catamaran Dr
- 1157 N Date Palm Dr
- 884 N Poinciana Ct Unit 5
- 2859 E Millbrae Ln
- 811 N Poinciana Ct Unit 10
- 1148 N Date Palm Dr
- 1756 E Queen Palm Dr
- 1748 E Queen Palm Dr
- 2319 E Beachcomber Dr
- 2307 E Beachcomber Dr
- 2314 E Indigo Bay Dr
- 2320 E Indigo Bay Dr
- 2301 E Beachcomber Dr
- 2308 E Indigo Bay Dr
- 2325 E Beachcomber Dr
- 2314 E Beachcomber Dr
- 2320 E Beachcomber Dr
- 2326 E Indigo Bay Dr
- 2302 E Beachcomber Dr
- 2302 E Indigo Bay Dr
- 2326 E Beachcomber Dr
- 2267 E Beachcomber Dr
- 2268 E Beachcomber Dr
- 2313 E Indigo Bay Dr
- 2319 E Indigo Bay Dr
- 2268 E Indigo Bay Dr
- 1208 N Jamaica Way
- 1225 N Jamaica Way
Your Personal Tour Guide
Ask me questions while you tour the home.