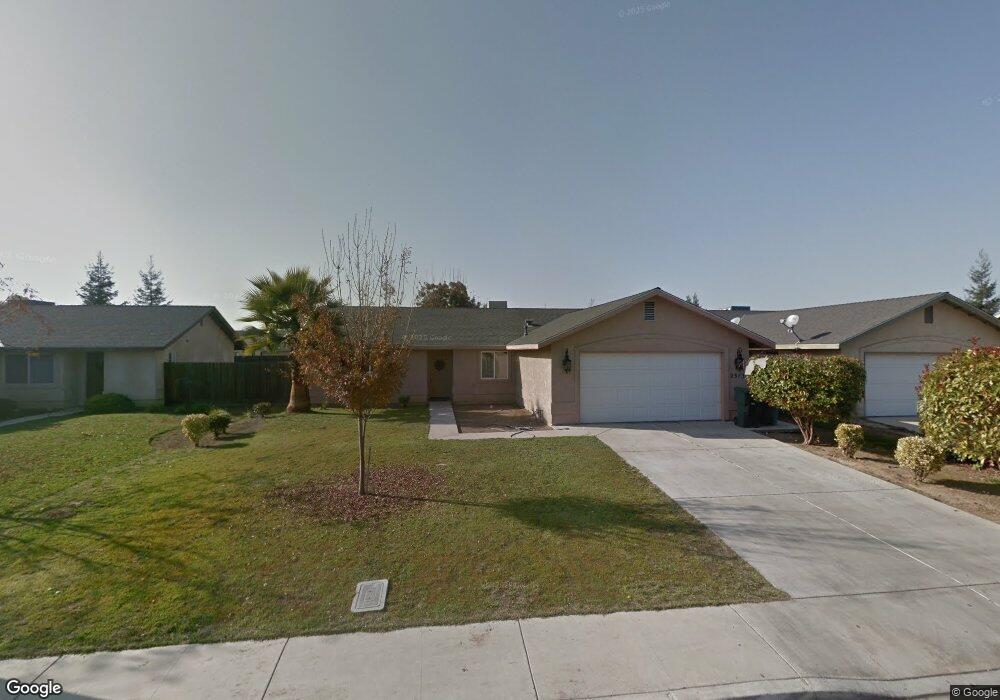
2313 N Jacob Ct Visalia, CA 93291
North Visalia NeighborhoodEstimated Value: $278,000 - $324,000
3
Beds
2
Baths
1,289
Sq Ft
$237/Sq Ft
Est. Value
About This Home
This home is located at 2313 N Jacob Ct, Visalia, CA 93291 and is currently estimated at $305,849, approximately $237 per square foot. 2313 N Jacob Ct is a home located in Tulare County with nearby schools including Riverway Elementary School, Valley Oak Middle School, and Golden West High School.
Ownership History
Date
Name
Owned For
Owner Type
Purchase Details
Closed on
Sep 8, 2011
Sold by
Bank Of America N A
Bought by
Serrano Annal E
Current Estimated Value
Home Financials for this Owner
Home Financials are based on the most recent Mortgage that was taken out on this home.
Original Mortgage
$84,696
Outstanding Balance
$57,526
Interest Rate
4.09%
Mortgage Type
FHA
Estimated Equity
$248,323
Purchase Details
Closed on
Jun 6, 2011
Sold by
Martinez Modesto and Flores Juana
Bought by
Bac Home Loans Servicing Lp and Countrywide Home Loans Servicing Lp
Purchase Details
Closed on
Feb 18, 2004
Sold by
Morgan Enterprises Inc
Bought by
Martinez Modesto and Flores Juana
Home Financials for this Owner
Home Financials are based on the most recent Mortgage that was taken out on this home.
Original Mortgage
$105,728
Interest Rate
4.87%
Mortgage Type
New Conventional
Create a Home Valuation Report for This Property
The Home Valuation Report is an in-depth analysis detailing your home's value as well as a comparison with similar homes in the area
Home Values in the Area
Average Home Value in this Area
Purchase History
| Date | Buyer | Sale Price | Title Company |
|---|---|---|---|
| Serrano Annal E | $87,000 | Pasion Title Services | |
| Bac Home Loans Servicing Lp | $104,400 | Landsafe Title | |
| Martinez Modesto | $132,500 | First American Title Co |
Source: Public Records
Mortgage History
| Date | Status | Borrower | Loan Amount |
|---|---|---|---|
| Open | Serrano Annal E | $84,696 | |
| Previous Owner | Martinez Modesto | $105,728 |
Source: Public Records
Tax History Compared to Growth
Tax History
| Year | Tax Paid | Tax Assessment Tax Assessment Total Assessment is a certain percentage of the fair market value that is determined by local assessors to be the total taxable value of land and additions on the property. | Land | Improvement |
|---|---|---|---|---|
| 2025 | $1,242 | $117,305 | $31,400 | $85,905 |
| 2024 | $1,242 | $115,006 | $30,785 | $84,221 |
| 2023 | $1,209 | $112,752 | $30,182 | $82,570 |
| 2022 | $1,157 | $110,542 | $29,591 | $80,951 |
| 2021 | $1,157 | $108,375 | $29,011 | $79,364 |
| 2020 | $1,141 | $107,264 | $28,714 | $78,550 |
| 2019 | $1,115 | $105,161 | $28,151 | $77,010 |
| 2018 | $1,075 | $103,099 | $27,599 | $75,500 |
| 2017 | $979 | $93,074 | $27,057 | $66,017 |
| 2016 | $953 | $91,249 | $26,526 | $64,723 |
| 2015 | $925 | $89,879 | $26,128 | $63,751 |
| 2014 | $925 | $88,118 | $25,616 | $62,502 |
Source: Public Records
Map
Nearby Homes
- 2341 N Jacob Ct
- 2418 N Jacob Ct
- 0 W Ferguson Ave Unit 214901
- 1703 N Stevenson St
- 1025 W Dove Dr
- 2041 N Rinaldi Ct
- 2746 N Giddings St
- 1635 N Dinuba Blvd
- 1625 W Sunnyview Ave
- 2015 N Hall Ct
- 223 W Buena Vista Ave
- 1408 N Park St
- 1322 W Prescott Ave
- 1322 W Prescott Ave Unit Lot3012
- 1030 W Prescott Ave
- 1540 N Encina St
- 125 N Hicks St Unit A
- The Buttercup Plan at Huckleberry Park
- The Waterlily Plan at Huckleberry Park
- The Juniper Plan at Huckleberry Park
- 2321 N Jacob Ct
- 2307 N Jacob Ct
- 2318 N Turner Ct
- 2312 N Turner Ct
- 2333 N Jacob Ct
- 2235 N Jacob Ct
- 2324 N Turner Ct
- 2234 N Turner Ct
- 2314 N Jacob Ct
- 2308 N Jacob Ct
- 2322 N Jacob Ct
- 2336 N Turner Ct
- 2221 N Jacob Ct
- 2220 N Turner Ct
- 2236 N Jacob Ct
- 2334 N Jacob Ct
- 2222 N Jacob Ct
- 2210 N Turner Ct
- 2401 N Jacob Ct
- 2342 N Jacob Ct