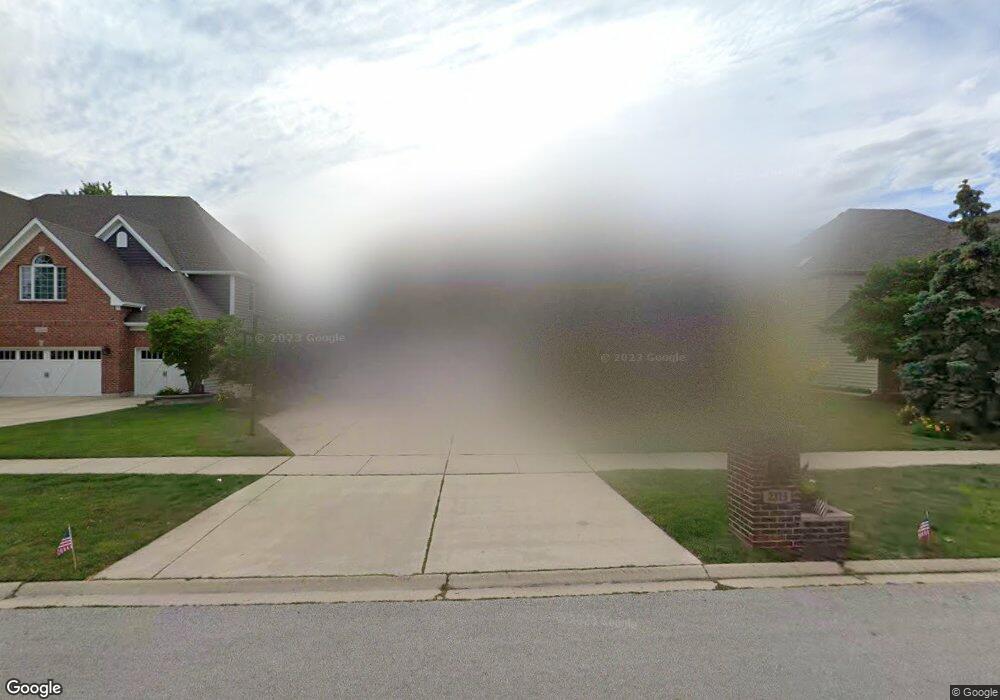
2315 Fox Boro Ln Naperville, IL 60564
Stillwater NeighborhoodEstimated Value: $930,052 - $961,000
6
Beds
3
Baths
3,874
Sq Ft
$243/Sq Ft
Est. Value
About This Home
This home is located at 2315 Fox Boro Ln, Naperville, IL 60564 and is currently estimated at $943,263, approximately $243 per square foot. 2315 Fox Boro Ln is a home located in Will County with nearby schools including Williamsfield Elementary School, Welch Elementary School, and Ellsworth Elementary School.
Ownership History
Date
Name
Owned For
Owner Type
Purchase Details
Closed on
Mar 22, 2006
Sold by
Sampson Jon J and Sampson Sarah E
Bought by
Ortiz Alfred D
Current Estimated Value
Home Financials for this Owner
Home Financials are based on the most recent Mortgage that was taken out on this home.
Original Mortgage
$549,600
Outstanding Balance
$352,938
Interest Rate
8.59%
Mortgage Type
Purchase Money Mortgage
Estimated Equity
$590,325
Purchase Details
Closed on
Dec 21, 1999
Sold by
Oliver Hoffman Corp
Bought by
Sampson Jon J and Sampson Sarah E
Home Financials for this Owner
Home Financials are based on the most recent Mortgage that was taken out on this home.
Original Mortgage
$349,000
Interest Rate
7.37%
Create a Home Valuation Report for This Property
The Home Valuation Report is an in-depth analysis detailing your home's value as well as a comparison with similar homes in the area
Home Values in the Area
Average Home Value in this Area
Purchase History
| Date | Buyer | Sale Price | Title Company |
|---|---|---|---|
| Ortiz Alfred D | $687,000 | First American Title | |
| Sampson Jon J | $437,500 | Chicago Title Insurance Co |
Source: Public Records
Mortgage History
| Date | Status | Borrower | Loan Amount |
|---|---|---|---|
| Open | Ortiz Alfred D | $549,600 | |
| Previous Owner | Sampson Jon J | $349,000 |
Source: Public Records
Tax History Compared to Growth
Tax History
| Year | Tax Paid | Tax Assessment Tax Assessment Total Assessment is a certain percentage of the fair market value that is determined by local assessors to be the total taxable value of land and additions on the property. | Land | Improvement |
|---|---|---|---|---|
| 2024 | $18,180 | $287,600 | $72,166 | $215,434 |
| 2023 | $18,180 | $252,029 | $63,751 | $188,278 |
| 2022 | $16,839 | $238,415 | $60,307 | $178,108 |
| 2021 | $16,102 | $227,062 | $57,435 | $169,627 |
| 2020 | $16,036 | $223,464 | $56,525 | $166,939 |
| 2019 | $15,533 | $217,166 | $54,932 | $162,234 |
| 2018 | $15,432 | $212,012 | $53,724 | $158,288 |
| 2017 | $15,201 | $206,539 | $52,337 | $154,202 |
| 2016 | $15,176 | $202,093 | $51,210 | $150,883 |
| 2015 | $15,100 | $194,320 | $49,240 | $145,080 |
| 2014 | $15,100 | $189,563 | $49,240 | $140,323 |
| 2013 | $15,100 | $189,563 | $49,240 | $140,323 |
Source: Public Records
Map
Nearby Homes
- 2543 Dewes Ln
- 2736 Bluewater Cir
- 2611 Cedar Glade Dr Unit 204
- 2220 Waterleaf Ct Unit 204
- 2227 Waterleaf Ct Unit 203
- 2511 Sheehan Dr Unit 203
- 2866 Stonewater Dr Unit 102
- 2207 Sisters Ave
- 28W555 Leverenz Rd
- 4284 Stableford Ln
- 1512 Harbour Towne Place
- 2636 Salix Cir
- 4258 Stableford Ln
- 3316 Club Ct
- 2301 Mecan Dr
- 3311 Fairmont Ave
- 1329 Neskola Ct
- 1321 Galena Ct
- 2949 Brossman St
- 3349 Rosecroft Ln Unit 2
- 2319 Fox Boro Ln Unit 2
- 2311 Fox Boro Ln
- 2323 Fox Boro Ln
- 2307 Fox Boro Ln
- 2312 Fox Boro Ln
- 2316 Fox Boro Ln
- 2320 Fox Boro Ln Unit 2
- 2327 Fox Boro Ln
- 2303 Fox Boro Ln
- 2324 Skylane Dr
- 2324 Fox Boro Ln
- 2328 Skylane Dr
- 2304 Simsbury Ct
- 2320 Skylane Dr
- 2331 Fox Boro Ln
- 2316 Skylane Dr
- 2332 Skylane Dr
- 2331 Simsbury Ct
- 2327 Simsbury Ct Unit 2
- 2328 Fox Boro Ln