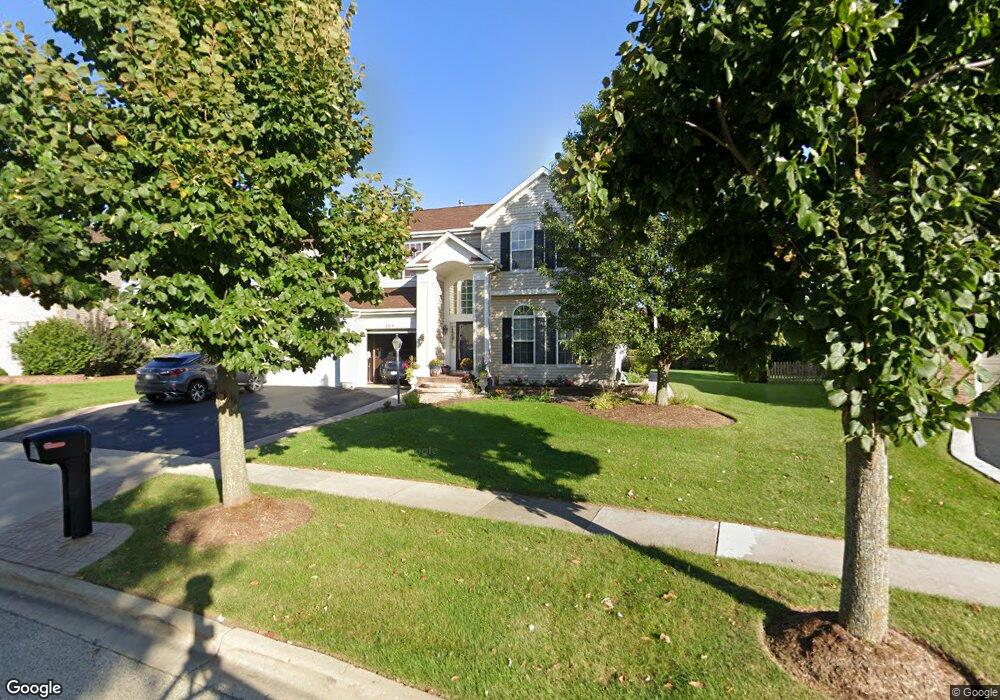
2315 Loop Rd Algonquin, IL 60102
Estimated Value: $522,978 - $596,000
4
Beds
--
Bath
3,386
Sq Ft
$168/Sq Ft
Est. Value
About This Home
This home is located at 2315 Loop Rd, Algonquin, IL 60102 and is currently estimated at $569,745, approximately $168 per square foot. 2315 Loop Rd is a home located in Kane County with nearby schools including Westfield Community School and Harry D Jacobs High School.
Ownership History
Date
Name
Owned For
Owner Type
Purchase Details
Closed on
May 31, 2017
Sold by
Tsay Imad and Tsay Maryam
Bought by
Tsay Imad and Tsay Maryam K
Current Estimated Value
Purchase Details
Closed on
Apr 26, 2000
Sold by
Willoughby Farms Ltd Partnership
Bought by
Tsay Imad and Tsay Maryam
Home Financials for this Owner
Home Financials are based on the most recent Mortgage that was taken out on this home.
Original Mortgage
$252,700
Outstanding Balance
$87,237
Interest Rate
8.13%
Estimated Equity
$482,508
Create a Home Valuation Report for This Property
The Home Valuation Report is an in-depth analysis detailing your home's value as well as a comparison with similar homes in the area
Purchase History
| Date | Buyer | Sale Price | Title Company |
|---|---|---|---|
| Tsay Imad | -- | None Available | |
| Tsay Imad | $316,000 | Stewart Title Company |
Source: Public Records
Mortgage History
| Date | Status | Borrower | Loan Amount |
|---|---|---|---|
| Open | Tsay Imad | $252,700 | |
| Closed | Tsay Imad | $32,100 |
Source: Public Records
Tax History
| Year | Tax Paid | Tax Assessment Tax Assessment Total Assessment is a certain percentage of the fair market value that is determined by local assessors to be the total taxable value of land and additions on the property. | Land | Improvement |
|---|---|---|---|---|
| 2024 | $11,277 | $156,905 | $26,492 | $130,413 |
| 2023 | $10,716 | $141,178 | $23,837 | $117,341 |
| 2022 | $10,441 | $132,744 | $23,837 | $108,907 |
| 2021 | $10,128 | $125,337 | $22,507 | $102,830 |
| 2020 | $9,926 | $122,519 | $22,001 | $100,518 |
| 2019 | $9,623 | $116,308 | $20,886 | $95,422 |
| 2018 | $9,690 | $114,005 | $20,472 | $93,533 |
| 2017 | $9,290 | $106,647 | $19,151 | $87,496 |
| 2016 | $9,638 | $104,458 | $18,543 | $85,915 |
| 2015 | -- | $95,179 | $17,040 | $78,139 |
| 2014 | -- | $89,802 | $16,569 | $73,233 |
| 2013 | -- | $92,551 | $17,076 | $75,475 |
Source: Public Records
Map
Nearby Homes
- 2258 Stonegate Rd
- 1951 Broadsmore Dr
- 1101 Waterford St
- 2313 Barrett Dr
- 1121 Waterford St
- 1020 Glenmont St
- 120 Newburgh Ln
- 1090 Glenmont St
- 1247 Glenmont St
- 1111 Glenmont St
- 1243 Glenmont St
- 1080 Glenmont St
- 1249 Glenmont St
- 1245 Glenmont St
- 1262 Glenmont St
- 2254 Stonegate Rd
- 1256 Glenmont St
- 1191 Waterford St
- 1254 Glenmont St
- 150 Newburgh Ln
Your Personal Tour Guide
Ask me questions while you tour the home.