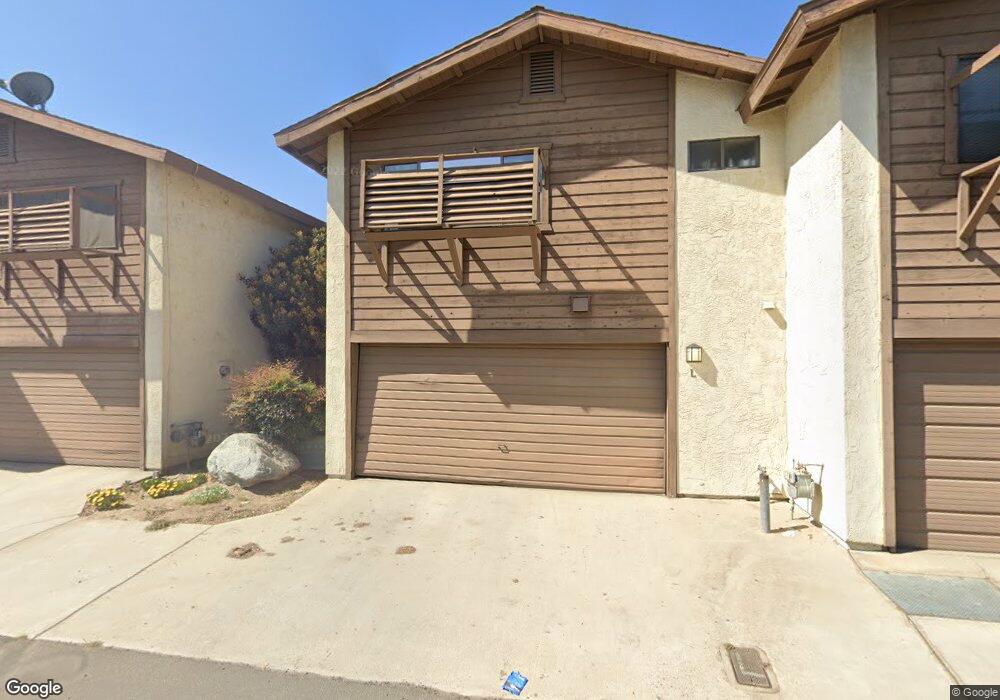
2316 Gosford Rd Unit B Bakersfield, CA 93309
Laurelglen NeighborhoodEstimated Value: $248,000 - $264,531
2
Beds
3
Baths
1,260
Sq Ft
$206/Sq Ft
Est. Value
About This Home
This home is located at 2316 Gosford Rd Unit B, Bakersfield, CA 93309 and is currently estimated at $259,883, approximately $206 per square foot. 2316 Gosford Rd Unit B is a home located in Kern County with nearby schools including Laurelglen Elementary School, Tevis Junior High School, and Bakersfield High School.
Ownership History
Date
Name
Owned For
Owner Type
Purchase Details
Closed on
Nov 11, 2021
Sold by
Peterson Shane M
Bought by
Peterson Shane M and Kotliarevskaia Anna
Current Estimated Value
Purchase Details
Closed on
Jul 19, 2016
Sold by
Valle David E
Bought by
Peterson Shane M
Home Financials for this Owner
Home Financials are based on the most recent Mortgage that was taken out on this home.
Original Mortgage
$117,800
Outstanding Balance
$93,979
Interest Rate
3.56%
Mortgage Type
New Conventional
Estimated Equity
$165,904
Purchase Details
Closed on
Oct 17, 2009
Sold by
Riden Anita J
Bought by
Valle David E
Home Financials for this Owner
Home Financials are based on the most recent Mortgage that was taken out on this home.
Original Mortgage
$91,575
Interest Rate
5.5%
Mortgage Type
FHA
Purchase Details
Closed on
Jan 5, 1998
Sold by
Riden Richard C
Bought by
Riden Anita J
Create a Home Valuation Report for This Property
The Home Valuation Report is an in-depth analysis detailing your home's value as well as a comparison with similar homes in the area
Home Values in the Area
Average Home Value in this Area
Purchase History
| Date | Buyer | Sale Price | Title Company |
|---|---|---|---|
| Peterson Shane M | -- | None Available | |
| Peterson Shane M | $124,000 | Placer Title Company | |
| Valle David E | $100,000 | Ticor Title Company Of Ca | |
| Riden Anita J | -- | -- |
Source: Public Records
Mortgage History
| Date | Status | Borrower | Loan Amount |
|---|---|---|---|
| Open | Peterson Shane M | $117,800 | |
| Previous Owner | Valle David E | $91,575 |
Source: Public Records
Tax History Compared to Growth
Tax History
| Year | Tax Paid | Tax Assessment Tax Assessment Total Assessment is a certain percentage of the fair market value that is determined by local assessors to be the total taxable value of land and additions on the property. | Land | Improvement |
|---|---|---|---|---|
| 2025 | $2,268 | $143,907 | $34,815 | $109,092 |
| 2024 | $2,228 | $141,086 | $34,133 | $106,953 |
| 2023 | $2,228 | $138,320 | $33,464 | $104,856 |
| 2022 | $2,134 | $135,608 | $32,808 | $102,800 |
| 2021 | $2,027 | $132,950 | $32,165 | $100,785 |
| 2020 | $1,982 | $131,588 | $31,836 | $99,752 |
| 2019 | $1,953 | $131,588 | $31,836 | $99,752 |
| 2018 | $1,852 | $126,480 | $30,600 | $95,880 |
| 2017 | $1,823 | $124,000 | $30,000 | $94,000 |
| 2016 | $1,570 | $109,037 | $21,806 | $87,231 |
| 2015 | $1,553 | $107,400 | $21,479 | $85,921 |
| 2014 | $1,513 | $105,297 | $21,059 | $84,238 |
Source: Public Records
Map
Nearby Homes
- 2316 Gosford Rd Unit W
- 2600 Brookside Dr Unit 40
- 2600 Brookside Dr Unit 46
- 7804 Revelstoke Way
- 8005 Shetland Dr
- 1906 Holt Rinehart Ave
- 7701 Shetland Dr
- 2300 El Portal Dr Unit 50
- 2300 El Portal Dr Unit 55
- 2300 El Portal Dr Unit 69
- 2209 Sully Ct
- 7713 Kamloops Dr
- 1912 Glenbrea Ct
- 2013 Calle Los Camichines
- 1811 Wadsworth Ave
- 7313 Calle Los Manzanos
- 1808 Delacorte Dr
- 2601 Manitou Way
- 7401 Hilton Head Way Unit 21
- 2200 El Portal Dr Unit 4
- 2316 Gosford Rd Unit S
- 2316 Gosford Rd
- 2316 Gosford Rd Unit M
- 2316 Gosford Rd Unit N
- 2316 Gosford Rd Unit P
- 2316 Gosford Rd Unit Q
- 2316 Gosford Rd Unit S
- 2316 Gosford Rd Unit T
- 2316 Gosford Rd Unit U
- 2316 Gosford Rd Unit V
- 2316 Gosford Rd Unit L
- 2316 Gosford Rd Unit K
- 2316 Gosford Rd Unit J
- 2316 Gosford Rd Unit I
- 2316 Gosford Rd Unit H
- 2316 Gosford Rd Unit G
- 2316 Gosford Rd Unit E
- 2316 Gosford Rd Unit A
- 2316 Gosford Rd Unit C
- 2300 Gosford Rd