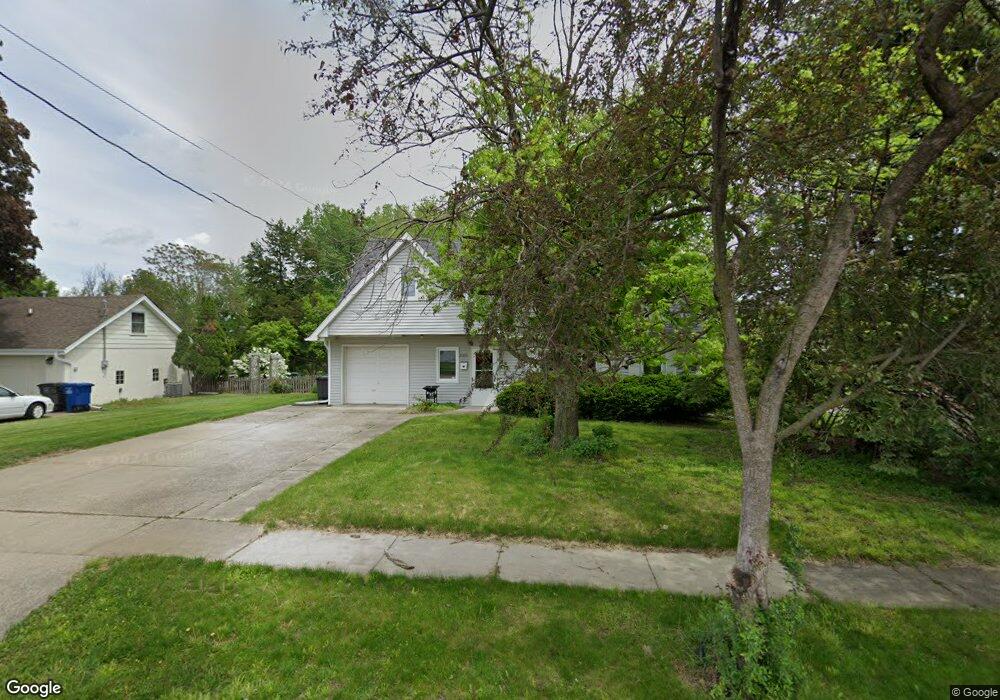
2317 57th St Des Moines, IA 50310
Merle Hay NeighborhoodEstimated Value: $243,000 - $287,000
3
Beds
1
Bath
1,735
Sq Ft
$152/Sq Ft
Est. Value
About This Home
This home is located at 2317 57th St, Des Moines, IA 50310 and is currently estimated at $263,856, approximately $152 per square foot. 2317 57th St is a home located in Polk County with nearby schools including Hillis Elementary School, Meredith Middle School, and Hoover High School.
Ownership History
Date
Name
Owned For
Owner Type
Purchase Details
Closed on
Jul 26, 2017
Sold by
Mara Sharon Kay O
Bought by
Sharon Kay O Mara Revocable Trust
Current Estimated Value
Purchase Details
Closed on
Oct 21, 2008
Sold by
Ford Robert L and Ford Melissa A
Bought by
Omara Sharon K
Home Financials for this Owner
Home Financials are based on the most recent Mortgage that was taken out on this home.
Original Mortgage
$102,800
Interest Rate
6.09%
Mortgage Type
Purchase Money Mortgage
Purchase Details
Closed on
Feb 16, 2004
Sold by
Nielsen Alice L and Estate Of Barbara A Nielsen
Bought by
Ford Robert L and Ford Melissa A
Create a Home Valuation Report for This Property
The Home Valuation Report is an in-depth analysis detailing your home's value as well as a comparison with similar homes in the area
Home Values in the Area
Average Home Value in this Area
Purchase History
| Date | Buyer | Sale Price | Title Company |
|---|---|---|---|
| Sharon Kay O Mara Revocable Trust | -- | None Available | |
| Omara Sharon K | $128,000 | None Available | |
| Ford Robert L | $134,500 | -- |
Source: Public Records
Mortgage History
| Date | Status | Borrower | Loan Amount |
|---|---|---|---|
| Previous Owner | Omara Sharon K | $102,800 |
Source: Public Records
Tax History Compared to Growth
Tax History
| Year | Tax Paid | Tax Assessment Tax Assessment Total Assessment is a certain percentage of the fair market value that is determined by local assessors to be the total taxable value of land and additions on the property. | Land | Improvement |
|---|---|---|---|---|
| 2025 | $4,336 | $252,200 | $53,400 | $198,800 |
| 2024 | $4,336 | $230,900 | $48,300 | $182,600 |
| 2023 | $4,348 | $230,900 | $48,300 | $182,600 |
| 2022 | $4,314 | $193,400 | $42,000 | $151,400 |
| 2021 | $4,200 | $193,400 | $42,000 | $151,400 |
| 2020 | $4,358 | $176,900 | $38,300 | $138,600 |
| 2019 | $4,044 | $176,900 | $38,300 | $138,600 |
| 2018 | $3,998 | $159,000 | $33,700 | $125,300 |
| 2017 | $3,658 | $159,000 | $33,700 | $125,300 |
| 2016 | $3,560 | $143,800 | $30,100 | $113,700 |
| 2015 | $3,560 | $143,800 | $30,100 | $113,700 |
| 2014 | $3,618 | $144,900 | $29,700 | $115,200 |
Source: Public Records
Map
Nearby Homes