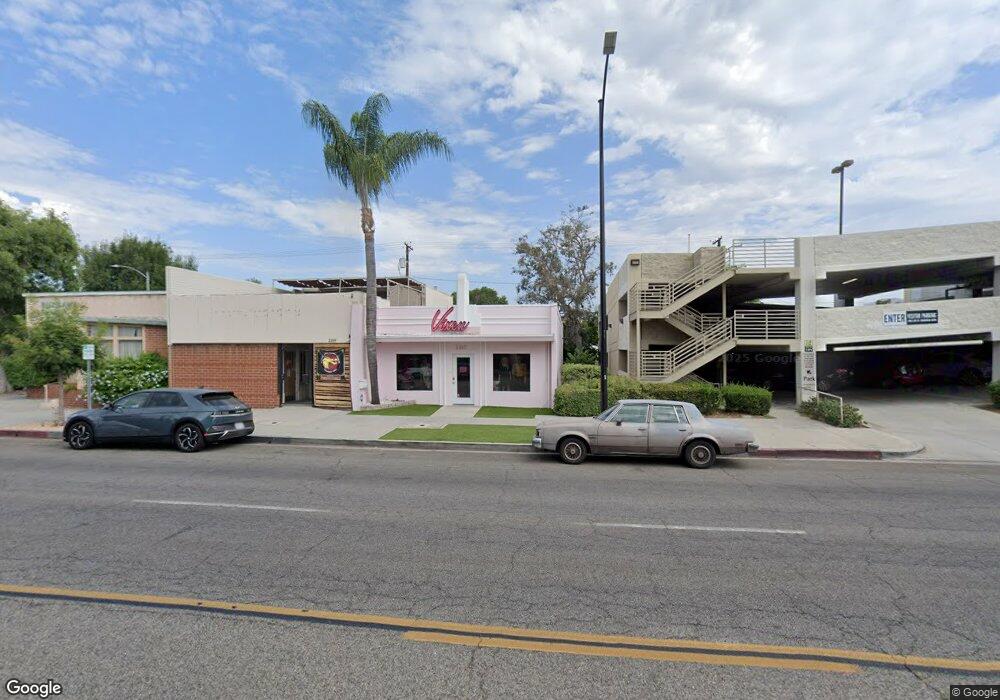
2317 W Magnolia Blvd Burbank, CA 91506
Chandler Park NeighborhoodEstimated Value: $1,370,289
--
Bed
--
Bath
1,375
Sq Ft
$997/Sq Ft
Est. Value
About This Home
This home is located at 2317 W Magnolia Blvd, Burbank, CA 91506 and is currently estimated at $1,370,289, approximately $996 per square foot. 2317 W Magnolia Blvd is a home located in Los Angeles County with nearby schools including Thomas Edison Elementary School, Dolores Huerta Middle School, and John Burroughs High School.
Ownership History
Date
Name
Owned For
Owner Type
Purchase Details
Closed on
May 30, 2018
Sold by
Weatherspoon John
Bought by
Micheline Pitt Property Llc
Current Estimated Value
Home Financials for this Owner
Home Financials are based on the most recent Mortgage that was taken out on this home.
Original Mortgage
$440,000
Interest Rate
4.5%
Mortgage Type
Commercial
Purchase Details
Closed on
Aug 10, 2005
Sold by
Mead Jonathan Radford
Bought by
Weatherspoon John
Home Financials for this Owner
Home Financials are based on the most recent Mortgage that was taken out on this home.
Original Mortgage
$494,500
Interest Rate
5.63%
Mortgage Type
Commercial
Purchase Details
Closed on
Feb 28, 2005
Sold by
Mcneilly Michael R and The Michael R Mcneilly Living
Bought by
Mead Jonathan Radford
Purchase Details
Closed on
May 16, 2003
Sold by
White Alvin S and White Sally A
Bought by
Mcneilly Michael R and Michael R Mcneilly Living Trust
Create a Home Valuation Report for This Property
The Home Valuation Report is an in-depth analysis detailing your home's value as well as a comparison with similar homes in the area
Home Values in the Area
Average Home Value in this Area
Purchase History
| Date | Buyer | Sale Price | Title Company |
|---|---|---|---|
| Micheline Pitt Property Llc | $850,000 | Ticor Title Company Of Calif | |
| Weatherspoon John | $695,000 | Gateway Title | |
| Mead Jonathan Radford | $575,000 | Gateway Title | |
| Mcneilly Michael R | $250,000 | Chicago Title |
Source: Public Records
Mortgage History
| Date | Status | Borrower | Loan Amount |
|---|---|---|---|
| Previous Owner | Micheline Pitt Property Llc | $440,000 | |
| Previous Owner | Weatherspoon John | $494,500 |
Source: Public Records
Tax History Compared to Growth
Tax History
| Year | Tax Paid | Tax Assessment Tax Assessment Total Assessment is a certain percentage of the fair market value that is determined by local assessors to be the total taxable value of land and additions on the property. | Land | Improvement |
|---|---|---|---|---|
| 2025 | $10,402 | $948,186 | $803,171 | $145,015 |
| 2024 | $10,402 | $929,595 | $787,423 | $142,172 |
| 2023 | $10,291 | $911,369 | $771,984 | $139,385 |
| 2022 | $9,821 | $893,500 | $756,848 | $136,652 |
| 2021 | $9,786 | $875,981 | $742,008 | $133,973 |
| 2019 | $9,388 | $850,000 | $720,000 | $130,000 |
| 2018 | $7,070 | $630,000 | $358,300 | $271,700 |
| 2016 | $6,327 | $570,000 | $324,200 | $245,800 |
| 2015 | $5,749 | $520,000 | $295,800 | $224,200 |
| 2014 | $4,840 | $429,000 | $244,000 | $185,000 |
Source: Public Records
Map
Nearby Homes
- 726 N Keystone St
- 831 N Myers St
- 835 N Lincoln St
- 500 N Lamer St
- 930 N Keystone St
- 611 N Buena Vista St
- 914 N Catalina St
- 532 N Reese Place
- 405 N Brighton St
- 825 N Catalina St
- 1121 N Frederic St
- 830 N Reese Place
- 2914 W Chandler Blvd
- 330 N Myers St
- 934 N Fairview St
- 1219 N Lincoln St
- 1115 N Florence St
- 1232 N Lincoln St
- 233 N Sparks St
- 819 N Fairview St
- 2319 W Magnolia Blvd
- 710 N Brighton St
- 2320 W Magnolia Blvd
- 716 N Brighton St
- 711 N Lincoln St
- 2403 W Magnolia Blvd
- 718 N Brighton St
- 711 N Brighton St
- 719 N Lincoln St
- 715 N Brighton St
- 722 N Brighton St
- 636 N Brighton St
- 2406 W Magnolia Blvd
- 719 N Brighton St
- 723 N Lincoln St
- 637 N Lincoln St
- 726 N Brighton St
- 634 N Brighton St
- 723 N Brighton St
- 637 N Brighton St