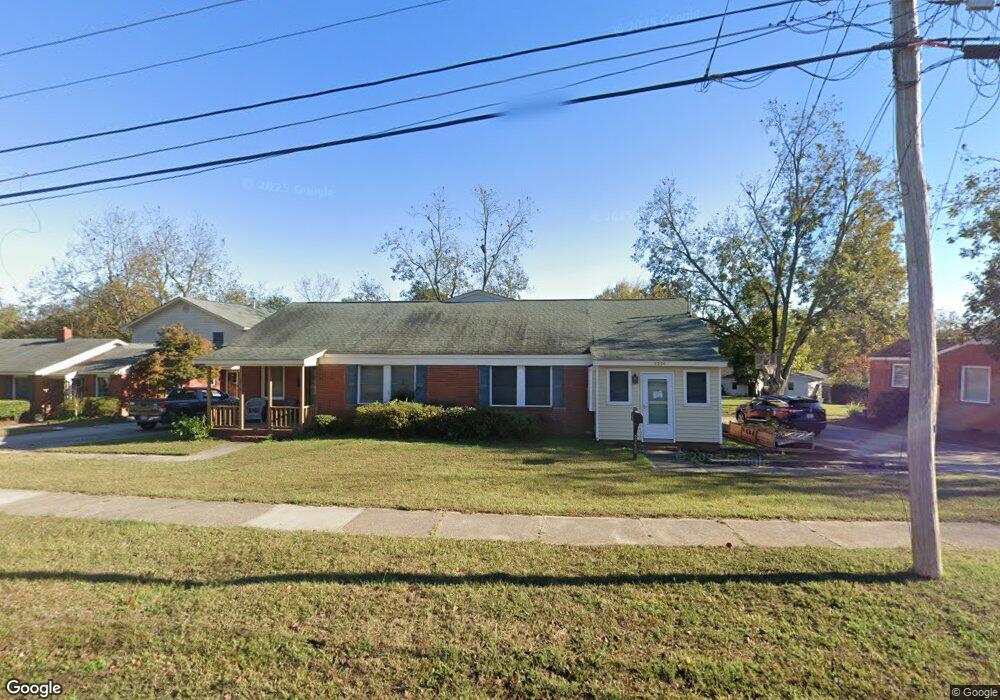
2318 Allen Ave Augusta, GA 30906
Richmond Hill NeighborhoodEstimated Value: $274,000 - $365,000
5
Beds
3
Baths
3,051
Sq Ft
$102/Sq Ft
Est. Value
About This Home
This home is located at 2318 Allen Ave, Augusta, GA 30906 and is currently estimated at $312,557, approximately $102 per square foot. 2318 Allen Ave is a home located in Richmond County with nearby schools including Murphey Middle School, Johnson Magnet, and Josey High School.
Ownership History
Date
Name
Owned For
Owner Type
Purchase Details
Closed on
Sep 5, 2024
Sold by
Portnov Boris
Bought by
Alleluia Christian Service Center Inc
Current Estimated Value
Purchase Details
Closed on
Jun 20, 2023
Sold by
Reeves Tara Lee
Bought by
Portnov Boris
Home Financials for this Owner
Home Financials are based on the most recent Mortgage that was taken out on this home.
Original Mortgage
$205,500
Interest Rate
6.57%
Mortgage Type
New Conventional
Purchase Details
Closed on
Sep 19, 2016
Sold by
Sharon B
Bought by
Reeves Tara Lee and Beasley Tanya Lynn
Purchase Details
Closed on
Feb 6, 1997
Sold by
Demello Robert
Bought by
Young Sharon B
Purchase Details
Closed on
Dec 19, 1995
Sold by
Alleluia Christian Service Center Inc Th
Bought by
Young Sharon B
Purchase Details
Closed on
Dec 1, 1995
Sold by
Alleluia Alleluia and Alleluia Christian
Bought by
Young Sharon B
Create a Home Valuation Report for This Property
The Home Valuation Report is an in-depth analysis detailing your home's value as well as a comparison with similar homes in the area
Home Values in the Area
Average Home Value in this Area
Purchase History
| Date | Buyer | Sale Price | Title Company |
|---|---|---|---|
| Alleluia Christian Service Center Inc | $315,000 | -- | |
| Portnov Boris | $274,000 | -- | |
| Reeves Tara Lee | -- | -- | |
| Young Sharon B | -- | -- | |
| Young Sharon B | -- | -- | |
| Young Sharon B | $30,000 | -- |
Source: Public Records
Mortgage History
| Date | Status | Borrower | Loan Amount |
|---|---|---|---|
| Previous Owner | Portnov Boris | $205,500 |
Source: Public Records
Tax History
| Year | Tax Paid | Tax Assessment Tax Assessment Total Assessment is a certain percentage of the fair market value that is determined by local assessors to be the total taxable value of land and additions on the property. | Land | Improvement |
|---|---|---|---|---|
| 2025 | $3,977 | $116,580 | $5,600 | $110,980 |
| 2024 | $3,977 | $107,176 | $5,600 | $101,576 |
| 2023 | $1,253 | $83,976 | $5,600 | $78,376 |
| 2022 | $1,508 | $82,439 | $5,600 | $76,839 |
| 2021 | $1,343 | $53,928 | $5,600 | $48,328 |
| 2020 | $1,280 | $53,928 | $5,600 | $48,328 |
| 2019 | $1,321 | $53,928 | $5,600 | $48,328 |
| 2018 | $1,325 | $53,928 | $5,600 | $48,328 |
| 2017 | $1,290 | $53,928 | $5,600 | $48,328 |
| 2016 | $1,069 | $36,456 | $5,600 | $30,856 |
| 2015 | $1,069 | $36,456 | $5,600 | $30,856 |
| 2014 | $1,069 | $36,456 | $5,600 | $30,856 |
Source: Public Records
Map
Nearby Homes
- 2366 Ruby Dr
- 2808 Richmond Hill Rd
- 2434 Young Dr
- 2411 Ruby Dr
- 2816 King St
- 2702 Richmond Hill Rd
- 2916 Whistler Ln
- 2820 Richmond Hill Rd
- 2810 Anne St
- 2531 Norton Blvd
- 2529 Norton Blvd
- 2550 Wheeless Rd
- 2804 Jordan St
- 2802 Jordan St
- 2533 Lyman St
- 2423 Eagle Dr
- 2537 Lyman St
- 2558 Lyman St
- 2544 Sheraton Dr
- 2148 Eastside Ct
- 2320 Allen Ave
- 2324 Allen Ave
- 2316 Allen Ave
- 2337 Norton Dr
- 2333 Norton Dr
- 2344 Franklin St
- 2326 Allen Ave
- 2317 Allen Ave
- 2325 Norton Dr
- 2310 Allen Ave
- 2342 Franklin St
- 2329 Norton Dr
- 2329 Allen Ave
- 2321 Allen Ct
- 2308 Allen Ave
- 2341 Franklin St
- 2321 Norton Dr
- 2333 Allen Ave
- 2325 Allen Ct
- 2346 Norton Dr
Your Personal Tour Guide
Ask me questions while you tour the home.