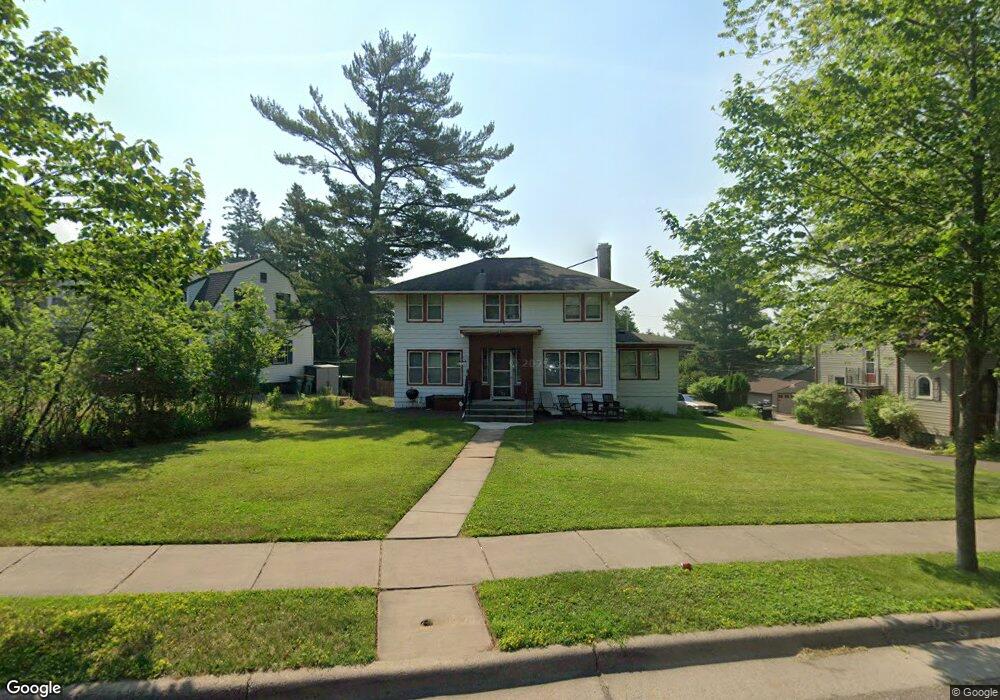
2318 E 8th St Duluth, MN 55812
Chester Park NeighborhoodEstimated Value: $479,186 - $623,000
5
Beds
3
Baths
3,031
Sq Ft
$179/Sq Ft
Est. Value
About This Home
This home is located at 2318 E 8th St, Duluth, MN 55812 and is currently estimated at $542,547, approximately $178 per square foot. 2318 E 8th St is a home located in St. Louis County with nearby schools including Congdon Elementary School, Ordean East Middle School, and East High School.
Ownership History
Date
Name
Owned For
Owner Type
Purchase Details
Closed on
Mar 30, 2007
Sold by
Samborski Linnea C and Samborski Craig
Bought by
Koos Zane T and Koos Evia Nugrahani
Current Estimated Value
Home Financials for this Owner
Home Financials are based on the most recent Mortgage that was taken out on this home.
Original Mortgage
$188,000
Outstanding Balance
$113,731
Interest Rate
6.25%
Mortgage Type
Purchase Money Mortgage
Estimated Equity
$428,816
Purchase Details
Closed on
Aug 30, 2005
Sold by
Linde Ivars A and Linde Stephanie A
Bought by
Stephan Linnea C and Samborski Craig
Home Financials for this Owner
Home Financials are based on the most recent Mortgage that was taken out on this home.
Original Mortgage
$57,350
Interest Rate
5.93%
Mortgage Type
Credit Line Revolving
Purchase Details
Closed on
Jan 4, 2005
Sold by
Wolden William H and Wolden Marlys M
Bought by
Linde Ivars A and Linde Stephanie A
Home Financials for this Owner
Home Financials are based on the most recent Mortgage that was taken out on this home.
Original Mortgage
$140,000
Interest Rate
6.5%
Mortgage Type
Purchase Money Mortgage
Create a Home Valuation Report for This Property
The Home Valuation Report is an in-depth analysis detailing your home's value as well as a comparison with similar homes in the area
Home Values in the Area
Average Home Value in this Area
Purchase History
| Date | Buyer | Sale Price | Title Company |
|---|---|---|---|
| Koos Zane T | $274,000 | Rels | |
| Stephan Linnea C | $286,751 | Rels | |
| Linde Ivars A | $228,000 | Pioneer |
Source: Public Records
Mortgage History
| Date | Status | Borrower | Loan Amount |
|---|---|---|---|
| Open | Koos Zane T | $188,000 | |
| Previous Owner | Stephan Linnea C | $57,350 | |
| Previous Owner | Stephan Linnea C | $229,400 | |
| Previous Owner | Linde Ivars A | $140,000 |
Source: Public Records
Tax History
| Year | Tax Paid | Tax Assessment Tax Assessment Total Assessment is a certain percentage of the fair market value that is determined by local assessors to be the total taxable value of land and additions on the property. | Land | Improvement |
|---|---|---|---|---|
| 2024 | $5,614 | $417,500 | $55,100 | $362,400 |
| 2023 | $5,614 | $403,500 | $54,400 | $349,100 |
| 2022 | $4,686 | $354,900 | $47,400 | $307,500 |
| 2021 | $4,630 | $293,600 | $38,700 | $254,900 |
| 2020 | $4,760 | $295,800 | $38,700 | $257,100 |
| 2019 | $4,638 | $295,600 | $35,100 | $260,500 |
| 2018 | $4,332 | $290,700 | $35,100 | $255,600 |
| 2017 | $3,958 | $290,700 | $35,100 | $255,600 |
| 2016 | $3,862 | $36,600 | $36,600 | $0 |
| 2015 | $3,447 | $222,400 | $41,000 | $181,400 |
| 2014 | $3,447 | $222,400 | $41,000 | $181,400 |
Source: Public Records
Map
Nearby Homes
- 2610 E 8th St
- 625 Woodland Ave
- 2123 E 4th St
- 2328 E 3rd St
- 721 N 20th Ave E
- xxx E 2nd St
- 2101 E 1st St
- 2815 E 2nd St
- 2510 E Superior St
- 619 N 18th Ave E
- 845 Grandview Ave
- 1745 Carver Ave
- 1914 E 1st St
- 1821 E 1st St
- 1905 E Superior St
- 1901 E Superior St
- 719 N 16th Ave E
- 215 W Arrowhead Rd
- 124 N Hawthorne Rd
- 1928 Jefferson St
Your Personal Tour Guide
Ask me questions while you tour the home.