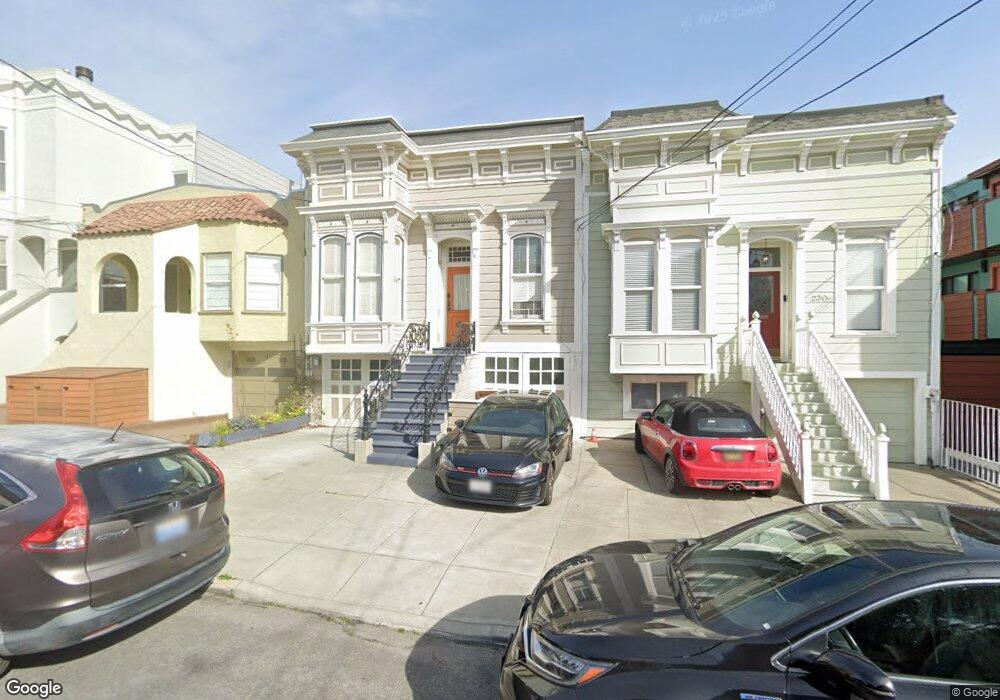
232 27th St San Francisco, CA 94131
Noe Valley NeighborhoodEstimated Value: $1,681,000 - $2,244,000
3
Beds
1
Bath
1,225
Sq Ft
$1,608/Sq Ft
Est. Value
About This Home
This home is located at 232 27th St, San Francisco, CA 94131 and is currently estimated at $1,969,338, approximately $1,607 per square foot. 232 27th St is a home located in San Francisco County with nearby schools including Alvarado Elementary, James Lick Middle School, and Katherine Michiels School.
Ownership History
Date
Name
Owned For
Owner Type
Purchase Details
Closed on
Jan 19, 2021
Sold by
Mar Caroline Mei Lin
Bought by
Mar Caroline Mei Lin and Mar Metivier Revocable Trust
Current Estimated Value
Purchase Details
Closed on
Jan 14, 2021
Sold by
Mar Warren and Mcdonough Susan
Bought by
Mar Caroline Mei Lin
Purchase Details
Closed on
Sep 3, 2005
Sold by
Mar Warren and Mcdonough Susan
Bought by
Mar Warren and Mcdonough Susan
Purchase Details
Closed on
Nov 16, 2001
Sold by
Pence David L and Pence Alison S
Bought by
Mar Warren and Mcdonough Susan
Home Financials for this Owner
Home Financials are based on the most recent Mortgage that was taken out on this home.
Original Mortgage
$250,000
Outstanding Balance
$96,631
Interest Rate
6.57%
Estimated Equity
$1,872,707
Create a Home Valuation Report for This Property
The Home Valuation Report is an in-depth analysis detailing your home's value as well as a comparison with similar homes in the area
Home Values in the Area
Average Home Value in this Area
Purchase History
| Date | Buyer | Sale Price | Title Company |
|---|---|---|---|
| Mar Caroline Mei Lin | -- | None Available | |
| Mar Caroline Mei Lin | -- | None Available | |
| Mar Warren | -- | -- | |
| Mar Warren | $762,500 | Fidelity National Title Co |
Source: Public Records
Mortgage History
| Date | Status | Borrower | Loan Amount |
|---|---|---|---|
| Open | Mar Warren | $250,000 |
Source: Public Records
Tax History Compared to Growth
Tax History
| Year | Tax Paid | Tax Assessment Tax Assessment Total Assessment is a certain percentage of the fair market value that is determined by local assessors to be the total taxable value of land and additions on the property. | Land | Improvement |
|---|---|---|---|---|
| 2025 | $14,769 | $1,217,271 | $675,856 | $541,415 |
| 2024 | $14,769 | $1,193,404 | $662,604 | $530,800 |
| 2023 | $14,545 | $1,170,005 | $649,612 | $520,393 |
| 2022 | $14,265 | $1,147,065 | $636,875 | $510,190 |
| 2021 | $13,929 | $1,124,575 | $624,388 | $500,187 |
| 2020 | $13,996 | $1,113,045 | $617,986 | $495,059 |
| 2019 | $13,515 | $1,091,222 | $605,869 | $485,353 |
| 2018 | $13,059 | $1,069,828 | $593,990 | $475,838 |
| 2017 | $12,606 | $1,048,853 | $582,344 | $466,509 |
| 2016 | $12,395 | $1,028,289 | $570,926 | $457,363 |
| 2015 | $12,240 | $1,012,845 | $562,351 | $450,494 |
| 2014 | $11,917 | $993,007 | $551,336 | $441,671 |
Source: Public Records
Map
Nearby Homes
- 245 Duncan St
- 101 28th St
- 248 Valley St
- 3936 26th St
- 55 Valley St
- 55 Valley St Unit 57
- 1325 Church St
- 1541 Sanchez St
- 3779-3781 25th St
- 4040 Cesar Chavez
- 1655 Dolores St
- 350 San Jose Ave Unit 7
- 350 San Jose Ave Unit 12
- 350 San Jose Ave Unit 5
- 340 San Jose Ave
- 1294 Guerrero St
- 1463 Noe St
- 440-442 29th St
- 1485 Noe St
- 1474 Noe St
- 234 27th St Unit 1
- 234 27th St
- 230 27th St
- 226 27th St Unit 1
- 226 27th St Unit 7
- 226 27th St Unit 4
- 226 27th St Unit 9
- 226 27th St Unit 3
- 226 27th St Unit 6
- 226 27th St Unit 2
- 226 27th St Unit 8
- 226 27th St Unit 5
- 226 27th St Unit 10
- 238 27th St
- 240 27th St
- 224 27th St
- 3859 Cesar Chavez St
- 3863 Cesar Chavez St
- 3853 Cesar Chavez St
- 3851 Cesar Chavez St