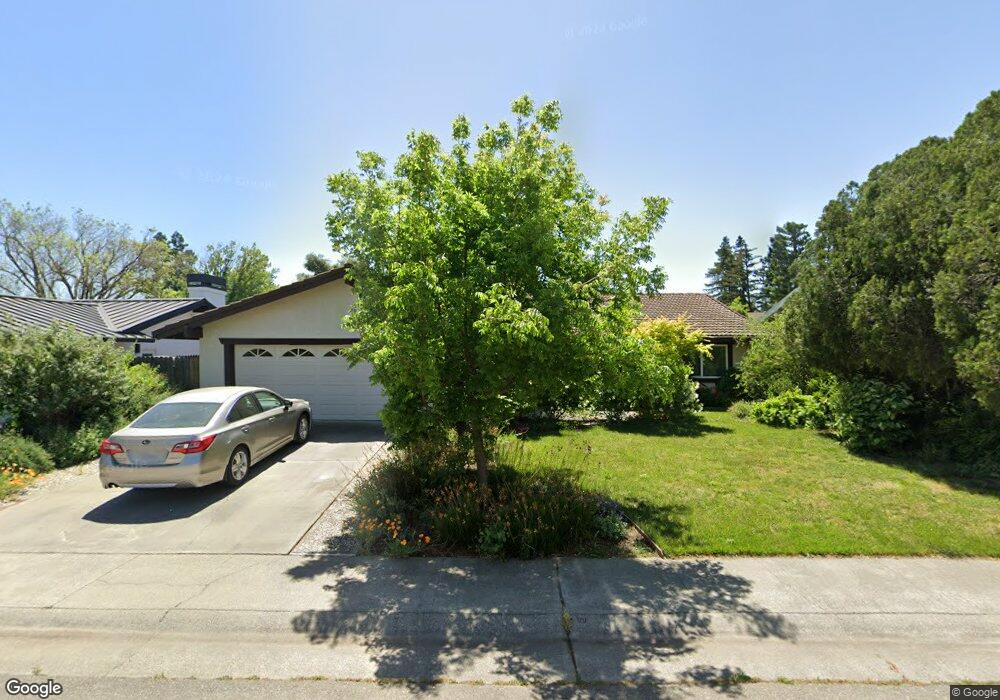
232 Faro Ave Davis, CA 95616
North Davis NeighborhoodEstimated Value: $822,000 - $867,000
4
Beds
2
Baths
1,849
Sq Ft
$458/Sq Ft
Est. Value
About This Home
This home is located at 232 Faro Ave, Davis, CA 95616 and is currently estimated at $847,206, approximately $458 per square foot. 232 Faro Ave is a home located in Yolo County with nearby schools including North Davis Elementary School, Oliver Wendell Holmes Junior High School, and Davis Senior High School.
Ownership History
Date
Name
Owned For
Owner Type
Purchase Details
Closed on
Dec 14, 2021
Sold by
Conant Clarke R
Bought by
Clarke Conant Trust
Current Estimated Value
Purchase Details
Closed on
Nov 20, 2020
Sold by
Conant Margaret A
Bought by
Conant Clarke R
Home Financials for this Owner
Home Financials are based on the most recent Mortgage that was taken out on this home.
Original Mortgage
$362,500
Interest Rate
2.8%
Mortgage Type
New Conventional
Purchase Details
Closed on
Jul 21, 2010
Sold by
King Garr M and King Mary Jo
Bought by
Conant Clark R and Conant Margaret A
Purchase Details
Closed on
Jun 2, 2005
Sold by
Royval Twila
Bought by
Conant Clark R and Conant Margaret A
Purchase Details
Closed on
Feb 1, 1999
Sold by
Royval Albert A
Bought by
Royval Twila
Create a Home Valuation Report for This Property
The Home Valuation Report is an in-depth analysis detailing your home's value as well as a comparison with similar homes in the area
Home Values in the Area
Average Home Value in this Area
Purchase History
| Date | Buyer | Sale Price | Title Company |
|---|---|---|---|
| Clarke Conant Trust | -- | None Listed On Document | |
| Conant Clarke R | -- | Fidelity Natl Ttl Co Of Ca | |
| Conant Clark R | $500,000 | None Available | |
| Conant Clark R | $637,500 | Old Republic Title Co | |
| Royval Twyla | -- | Old Republic Title Co | |
| Royval Twila | -- | -- | |
| Royval Albert A | -- | -- | |
| Royval Twila D | -- | -- |
Source: Public Records
Mortgage History
| Date | Status | Borrower | Loan Amount |
|---|---|---|---|
| Previous Owner | Conant Clarke R | $362,500 |
Source: Public Records
Tax History
| Year | Tax Paid | Tax Assessment Tax Assessment Total Assessment is a certain percentage of the fair market value that is determined by local assessors to be the total taxable value of land and additions on the property. | Land | Improvement |
|---|---|---|---|---|
| 2025 | $10,163 | $818,635 | $306,799 | $511,836 |
| 2023 | $10,163 | $786,848 | $294,887 | $491,961 |
| 2022 | $9,750 | $771,420 | $289,105 | $482,315 |
| 2021 | $9,532 | $756,295 | $283,437 | $472,858 |
| 2020 | $9,385 | $748,541 | $280,531 | $468,010 |
| 2019 | $8,657 | $700,000 | $250,000 | $450,000 |
| 2018 | $7,675 | $650,000 | $225,000 | $425,000 |
| 2017 | $7,442 | $630,000 | $225,000 | $405,000 |
| 2016 | $7,310 | $625,000 | $225,000 | $400,000 |
| 2015 | $6,295 | $600,000 | $225,000 | $375,000 |
| 2014 | $6,295 | $530,000 | $200,000 | $330,000 |
Source: Public Records
Map
Nearby Homes
- 116 Huerta Place
- 404 Cabrillo Ave
- 2128 Bueno Dr Unit 18
- 2230 Cannery Loop
- 2248 Cannery Loop
- 103 Grande Ave
- 1731 Heirloom St
- 1661 Spring St Unit 443
- 1661 Spring St Unit 444
- 1661 Spring St Unit 341
- 1661 Spring St Unit 433
- 1952 Cannery Loop
- 1037 Forbes Ln
- 2818 Anza Ave
- 1821 Cannery Loop
- 1769 Cannery Loop
- 632 Estrella Place
- 1673 Vine St
- 1053 Caspian Pink Terrace
- 1000 Berryessa Ln Unit 333
- 238 Faro Ave
- 226 Faro Ave
- 235 El Cajon Ave
- 241 El Cajon Ave
- 229 El Cajon Ave
- 244 Faro Ave Unit 246
- 220 Faro Ave
- 233 Faro Ave
- 227 Faro Ave
- 239 Faro Ave
- 223 El Cajon Ave
- 221 Faro Ave
- 214 Faro Ave
- 217 El Cajon Ave
- 230 Guaymas Place
- 234 El Cajon Ave
- 215 Faro Ave
- 240 El Cajon Ave
- 224 Guaymas Place
- 228 El Cajon Ave
Your Personal Tour Guide
Ask me questions while you tour the home.