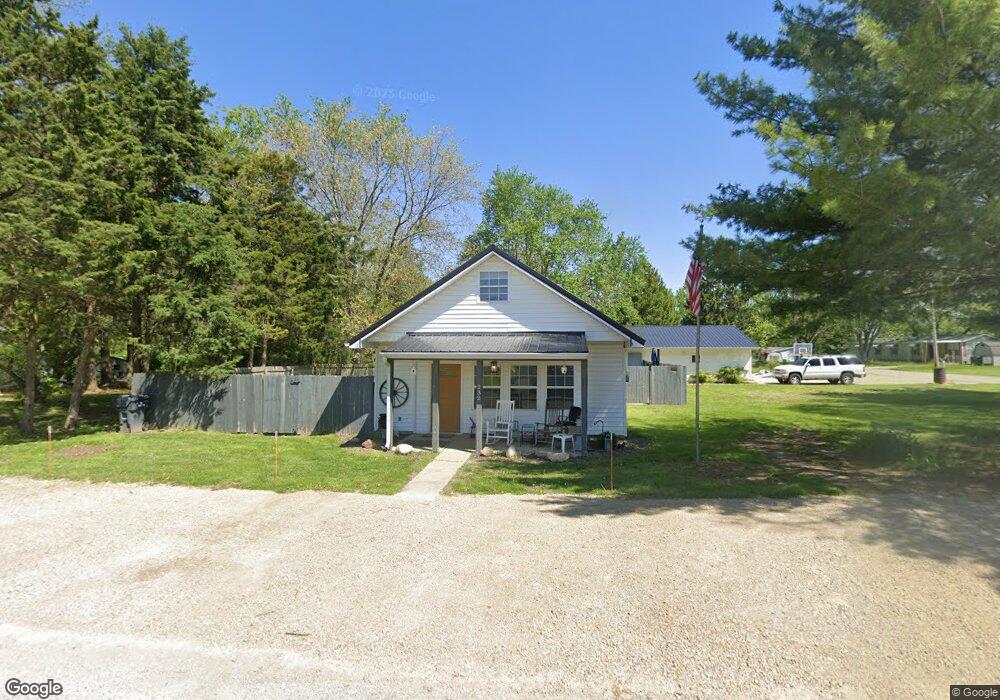
232 W Anson St Upland, IN 46989
Estimated Value: $174,796 - $196,000
3
Beds
1
Bath
1,896
Sq Ft
$98/Sq Ft
Est. Value
About This Home
This home is located at 232 W Anson St, Upland, IN 46989 and is currently estimated at $184,949, approximately $97 per square foot. 232 W Anson St is a home.
Ownership History
Date
Name
Owned For
Owner Type
Purchase Details
Closed on
Nov 15, 2016
Sold by
Martin Wesley T
Bought by
Thompson Dawn M
Current Estimated Value
Purchase Details
Closed on
Jan 25, 2008
Sold by
Thompson Dawn M
Bought by
Thompson Dawn M and Martin Weley T
Home Financials for this Owner
Home Financials are based on the most recent Mortgage that was taken out on this home.
Original Mortgage
$19,000
Interest Rate
5.62%
Mortgage Type
Future Advance Clause Open End Mortgage
Purchase Details
Closed on
Apr 23, 2003
Sold by
Not Provided
Bought by
Not Provided
Create a Home Valuation Report for This Property
The Home Valuation Report is an in-depth analysis detailing your home's value as well as a comparison with similar homes in the area
Home Values in the Area
Average Home Value in this Area
Purchase History
| Date | Buyer | Sale Price | Title Company |
|---|---|---|---|
| Thompson Dawn M | -- | None Available | |
| Thompson Dawn M | -- | None Available | |
| Not Provided | $134,999 | -- |
Source: Public Records
Mortgage History
| Date | Status | Borrower | Loan Amount |
|---|---|---|---|
| Previous Owner | Thompson Dawn M | $19,000 |
Source: Public Records
Tax History
| Year | Tax Paid | Tax Assessment Tax Assessment Total Assessment is a certain percentage of the fair market value that is determined by local assessors to be the total taxable value of land and additions on the property. | Land | Improvement |
|---|---|---|---|---|
| 2025 | $538 | $114,900 | $23,600 | $91,300 |
| 2024 | $538 | $99,900 | $23,600 | $76,300 |
| 2023 | $583 | $105,300 | $23,600 | $81,700 |
| 2022 | $572 | $97,800 | $17,600 | $80,200 |
| 2021 | $464 | $87,800 | $17,600 | $70,200 |
| 2020 | $406 | $85,500 | $16,800 | $68,700 |
| 2019 | $331 | $80,400 | $16,800 | $63,600 |
| 2018 | $305 | $80,900 | $15,400 | $65,500 |
| 2017 | $270 | $79,100 | $15,400 | $63,700 |
| 2016 | $257 | $79,300 | $15,400 | $63,900 |
| 2014 | $291 | $85,300 | $17,400 | $67,900 |
| 2013 | $291 | $94,300 | $15,400 | $78,900 |
Source: Public Records
Map
Nearby Homes
- 163 E Anson St
- Lot 8 W South St
- Lot 7 W South St
- Lot 9 W South St
- 328 W Jefferson St
- 776 W Harsax Dr
- 1016 S First St
- 715 Silverman Blvd
- 10080 E 500 S
- 9810 E 400 S
- 2300 S 8th St
- 7960 S 950 E
- 0 E 200 S Unit 202601439
- 1864 S 700 E
- 6611 S 500 E
- 300 E S
- 6004 E 200 S
- 0 County Road 425 S
- 66 Cobblestone Blvd
- 14 Cobblestone Blvd
Your Personal Tour Guide
Ask me questions while you tour the home.