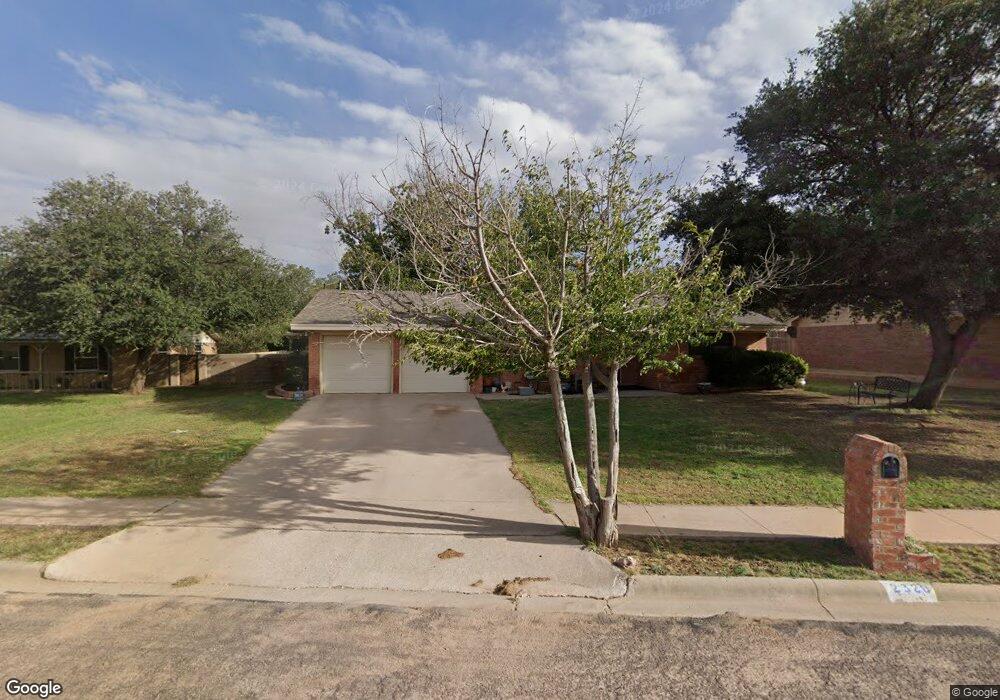
2320 Brent Dr Big Spring, TX 79720
Estimated Value: $200,000 - $257,000
--
Bed
--
Bath
3,283
Sq Ft
$67/Sq Ft
Est. Value
About This Home
This home is located at 2320 Brent Dr, Big Spring, TX 79720 and is currently estimated at $221,378, approximately $67 per square foot. 2320 Brent Dr is a home located in Howard County with nearby schools including Big Spring High School.
Ownership History
Date
Name
Owned For
Owner Type
Purchase Details
Closed on
Aug 15, 2018
Sold by
Valbuena Veronica
Bought by
Smith Rose M
Current Estimated Value
Home Financials for this Owner
Home Financials are based on the most recent Mortgage that was taken out on this home.
Original Mortgage
$137,750
Outstanding Balance
$119,630
Interest Rate
4.5%
Mortgage Type
New Conventional
Estimated Equity
$101,748
Purchase Details
Closed on
Apr 14, 2014
Sold by
Bedwell Jeremy and Bedwel Sydne
Bought by
Valbuena Veronica
Purchase Details
Closed on
Apr 5, 2011
Sold by
Chase Home Finance Llc
Bought by
Bedwell Jeremy
Home Financials for this Owner
Home Financials are based on the most recent Mortgage that was taken out on this home.
Original Mortgage
$102,465
Interest Rate
4.98%
Mortgage Type
New Conventional
Purchase Details
Closed on
Nov 2, 2010
Sold by
Norman Shelley and Norman James C
Bought by
Chase Home Finance Llc
Purchase Details
Closed on
Oct 28, 2009
Sold by
Norman Shelley
Bought by
Norman James C
Create a Home Valuation Report for This Property
The Home Valuation Report is an in-depth analysis detailing your home's value as well as a comparison with similar homes in the area
Home Values in the Area
Average Home Value in this Area
Purchase History
| Date | Buyer | Sale Price | Title Company |
|---|---|---|---|
| Smith Rose M | -- | Surety Title Company | |
| Valbuena Veronica | -- | Surety Title Company | |
| Bedwell Jeremy | -- | Surety Title Company | |
| Chase Home Finance Llc | $93,245 | None Available | |
| Norman James C | -- | Surety Title Company |
Source: Public Records
Mortgage History
| Date | Status | Borrower | Loan Amount |
|---|---|---|---|
| Open | Smith Rose M | $137,750 | |
| Previous Owner | Bedwell Jeremy | $102,465 |
Source: Public Records
Tax History Compared to Growth
Tax History
| Year | Tax Paid | Tax Assessment Tax Assessment Total Assessment is a certain percentage of the fair market value that is determined by local assessors to be the total taxable value of land and additions on the property. | Land | Improvement |
|---|---|---|---|---|
| 2024 | $3,510 | $197,233 | $16,200 | $181,033 |
| 2023 | $3,174 | $214,231 | $12,420 | $201,811 |
| 2022 | $3,341 | $198,302 | $9,000 | $189,302 |
| 2021 | $3,497 | $148,805 | $9,000 | $139,805 |
| 2020 | $3,389 | $144,619 | $9,000 | $135,619 |
| 2019 | $3,278 | $129,592 | $9,000 | $120,592 |
| 2018 | $3,931 | $131,198 | $9,000 | $122,198 |
| 2017 | $3,909 | $132,806 | $9,000 | $123,806 |
| 2016 | $3,956 | $134,413 | $9,000 | $125,413 |
| 2015 | -- | $127,217 | $6,750 | $120,467 |
| 2014 | -- | $115,151 | $6,750 | $108,401 |
Source: Public Records
Map
Nearby Homes
- 2308 Brent Dr
- Lot 31 Miami Cove
- Lot 25 Miami Cove
- 2405 E 25th St
- 2511 E 24th St
- 2402 S Monticello St
- 1404 Marijo Ave
- 2502 Cindy Ln
- 1908 Morrison Dr
- 1309 Marijo Ave
- 1710 Alabama St
- 2509 Carol Dr
- 1210 Marijo Ave
- 2608 E 24th St
- 2601 Central Dr
- 1302 Barnes Ave
- 1108 Stanford Ave
- 2004 N Monticello St
- 2606 Carol Dr
- 1200 Michael Ave
- 2318 Brent Dr
- 2322 Brent Dr
- 2324 Brent Dr
- 2316 Brent Dr
- 2311 Brent Dr
- 2313 Brent Dr
- 2411 Allendale Rd
- 2407 Allendale Rd
- 2309 Brent Dr
- 2410 Brent Dr
- 2314 Brent Dr
- 2307 Brent Dr
- 2405 Allendale Rd
- 2319 Allendale Rd
- 2315 Brent Dr
- 2407 Brent Dr
- 2509 Allendale Rd
- 2310 Brent Dr
- 2317 Allendale Rd
- 2401 Brent Dr