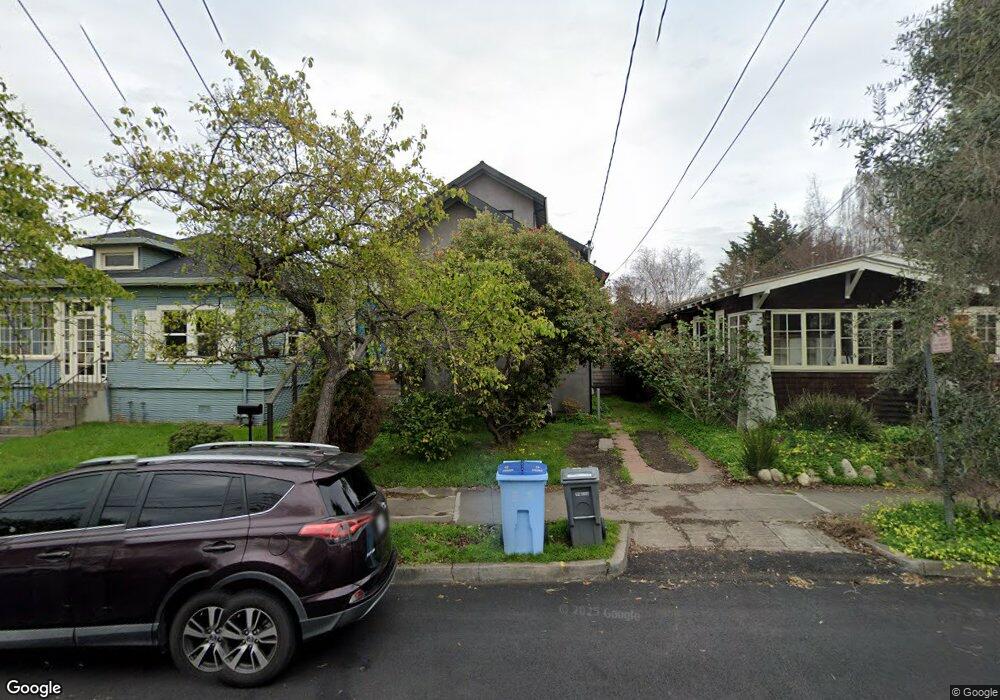
2321 Acton St Berkeley, CA 94702
West Berkeley NeighborhoodEstimated Value: $1,662,000 - $2,510,000
4
Beds
2
Baths
2,129
Sq Ft
$920/Sq Ft
Est. Value
About This Home
This home is located at 2321 Acton St, Berkeley, CA 94702 and is currently estimated at $1,958,988, approximately $920 per square foot. 2321 Acton St is a home located in Alameda County with nearby schools including Washington Elementary School, Oxford Elementary School, and Malcolm X Elementary School.
Ownership History
Date
Name
Owned For
Owner Type
Purchase Details
Closed on
Sep 20, 2004
Sold by
Cooke Milton P
Bought by
Kamenetzky Daniel and Munoz Denise
Current Estimated Value
Home Financials for this Owner
Home Financials are based on the most recent Mortgage that was taken out on this home.
Original Mortgage
$417,100
Outstanding Balance
$205,537
Interest Rate
5.8%
Mortgage Type
Purchase Money Mortgage
Estimated Equity
$1,753,451
Purchase Details
Closed on
Nov 11, 2000
Sold by
Cooke Milton P and Cooke Josephine
Bought by
Cooke Milton P
Purchase Details
Closed on
Nov 11, 1993
Sold by
Cooke Milton P
Bought by
Cooke Milton P and Cooke Josephine
Home Financials for this Owner
Home Financials are based on the most recent Mortgage that was taken out on this home.
Original Mortgage
$7,000
Interest Rate
7.09%
Create a Home Valuation Report for This Property
The Home Valuation Report is an in-depth analysis detailing your home's value as well as a comparison with similar homes in the area
Home Values in the Area
Average Home Value in this Area
Purchase History
| Date | Buyer | Sale Price | Title Company |
|---|---|---|---|
| Kamenetzky Daniel | $430,000 | Ticor Title Company Of Ca | |
| Cooke Milton P | -- | -- | |
| Cooke Milton P | -- | Fidelity National Title Ins |
Source: Public Records
Mortgage History
| Date | Status | Borrower | Loan Amount |
|---|---|---|---|
| Open | Kamenetzky Daniel | $417,100 | |
| Previous Owner | Cooke Milton P | $7,000 |
Source: Public Records
Tax History
| Year | Tax Paid | Tax Assessment Tax Assessment Total Assessment is a certain percentage of the fair market value that is determined by local assessors to be the total taxable value of land and additions on the property. | Land | Improvement |
|---|---|---|---|---|
| 2025 | $13,520 | $854,021 | $179,797 | $681,224 |
| 2024 | $13,520 | $837,142 | $176,273 | $667,869 |
| 2023 | $13,235 | $827,592 | $172,817 | $654,775 |
| 2022 | $12,987 | $804,369 | $169,429 | $641,940 |
| 2021 | $13,011 | $788,462 | $166,108 | $629,354 |
| 2020 | $12,281 | $787,309 | $164,405 | $622,904 |
| 2019 | $11,765 | $771,875 | $161,182 | $610,693 |
| 2018 | $11,817 | $756,744 | $158,023 | $598,721 |
| 2017 | $9,141 | $555,420 | $154,926 | $400,494 |
| 2016 | $7,094 | $506,298 | $151,889 | $354,409 |
| 2015 | $7,004 | $498,696 | $149,609 | $349,087 |
| 2014 | $6,966 | $488,931 | $146,679 | $342,252 |
Source: Public Records
Map
Nearby Homes
- 2304 Edwards St
- 2350 Sacramento St
- 2437 Acton St
- 2324 Browning St
- 1604 Dwight Way
- 1524 Blake St
- 2118 California St
- 2231 Byron St
- 1142 Dwight Way
- 1118 Dwight Way
- 1135 Parker St
- 1634 Blake St
- 1612 Parker St
- 1039 Channing Way
- 1515 Derby St
- 2423 10th St
- 1411 Hearst Ave Unit 2
- 1919 Curtis St
- 2717 Mabel St
- 1512 Hearst Ave Unit 1512
Your Personal Tour Guide
Ask me questions while you tour the home.