2321 Byrd St Raleigh, NC 27608
Estimated Value: $1,071,000 - $1,126,000
3
Beds
3
Baths
2,230
Sq Ft
$494/Sq Ft
Est. Value
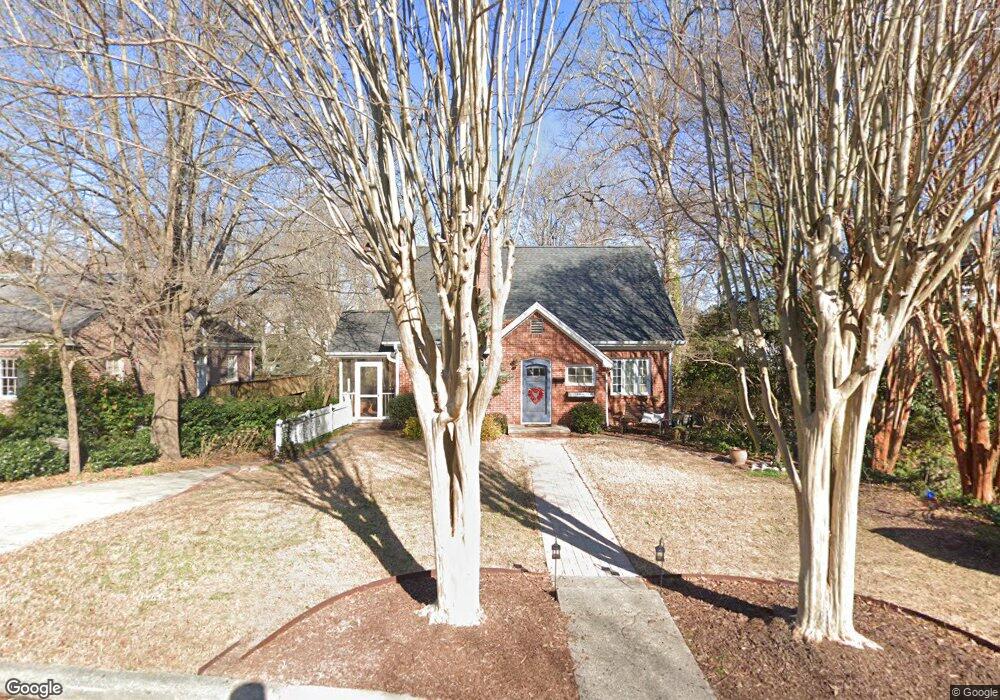
About This Home
This home is located at 2321 Byrd St, Raleigh, NC 27608 and is currently estimated at $1,101,396, approximately $493 per square foot. 2321 Byrd St is a home located in Wake County with nearby schools including Joyner Elementary School, Oberlin Middle School, and Broughton Magnet High School.
Ownership History
Date
Name
Owned For
Owner Type
Purchase Details
Closed on
Jul 30, 2009
Sold by
Ganim Mary Allyson
Bought by
Lai Vince and Lai Mary
Current Estimated Value
Home Financials for this Owner
Home Financials are based on the most recent Mortgage that was taken out on this home.
Original Mortgage
$408,000
Outstanding Balance
$261,366
Interest Rate
4.87%
Mortgage Type
New Conventional
Estimated Equity
$840,030
Purchase Details
Closed on
Jun 30, 2006
Sold by
Doerfler Michael T and Doerfler Jennifer T
Bought by
Ganim Mary Allyson
Home Financials for this Owner
Home Financials are based on the most recent Mortgage that was taken out on this home.
Original Mortgage
$400,000
Interest Rate
6.57%
Mortgage Type
Purchase Money Mortgage
Purchase Details
Closed on
Nov 15, 2000
Sold by
Purrington John V
Bought by
Doerfler Michael T and Doerfler Jennifer T
Create a Home Valuation Report for This Property
The Home Valuation Report is an in-depth analysis detailing your home's value as well as a comparison with similar homes in the area
Home Values in the Area
Average Home Value in this Area
Purchase History
| Date | Buyer | Sale Price | Title Company |
|---|---|---|---|
| Lai Vince | $510,000 | None Available | |
| Ganim Mary Allyson | $500,000 | None Available | |
| Doerfler Michael T | $420,000 | -- |
Source: Public Records
Mortgage History
| Date | Status | Borrower | Loan Amount |
|---|---|---|---|
| Open | Lai Vince | $408,000 | |
| Closed | Lai Vince | $51,000 | |
| Previous Owner | Ganim Mary Allyson | $400,000 | |
| Previous Owner | Ganim Mary Allyson | $50,000 |
Source: Public Records
Tax History Compared to Growth
Tax History
| Year | Tax Paid | Tax Assessment Tax Assessment Total Assessment is a certain percentage of the fair market value that is determined by local assessors to be the total taxable value of land and additions on the property. | Land | Improvement |
|---|---|---|---|---|
| 2025 | $8,402 | $961,128 | $653,125 | $308,003 |
| 2024 | $8,367 | $961,128 | $653,125 | $308,003 |
| 2023 | $6,796 | $621,637 | $397,100 | $224,537 |
| 2022 | $6,114 | $601,873 | $397,100 | $204,773 |
| 2021 | $5,876 | $601,873 | $397,100 | $204,773 |
| 2020 | $5,769 | $601,873 | $397,100 | $204,773 |
| 2019 | $6,064 | $521,569 | $323,000 | $198,569 |
| 2018 | $5,719 | $521,569 | $323,000 | $198,569 |
| 2017 | $5,446 | $521,569 | $323,000 | $198,569 |
| 2016 | $5,334 | $521,569 | $323,000 | $198,569 |
| 2015 | $5,719 | $550,407 | $316,800 | $233,607 |
| 2014 | $5,424 | $550,407 | $316,800 | $233,607 |
Source: Public Records
Map
Nearby Homes
- 2328 Byrd St
- 2303 Byrd St
- 2404 Beechridge Rd
- 2609 Hazelwood Dr
- 2605 Hazelwood Dr
- 2650 Marchmont St
- 2909 Montpelier Ct
- 1913 Glenwood Ave
- 2124 Fallon Oaks Ct
- 2651 Marchmont St
- 1902 Glenwood Ave
- 2712 Anderson Dr
- 2623 Marchmont St
- 2427 Glenwood Ave
- 2400 Fairview Rd
- 2622 Tidwell St
- 2610 Marchmont St
- 2620 Tidwell St
- 2612 Tidwell St
- 2619 Birney Park Cir