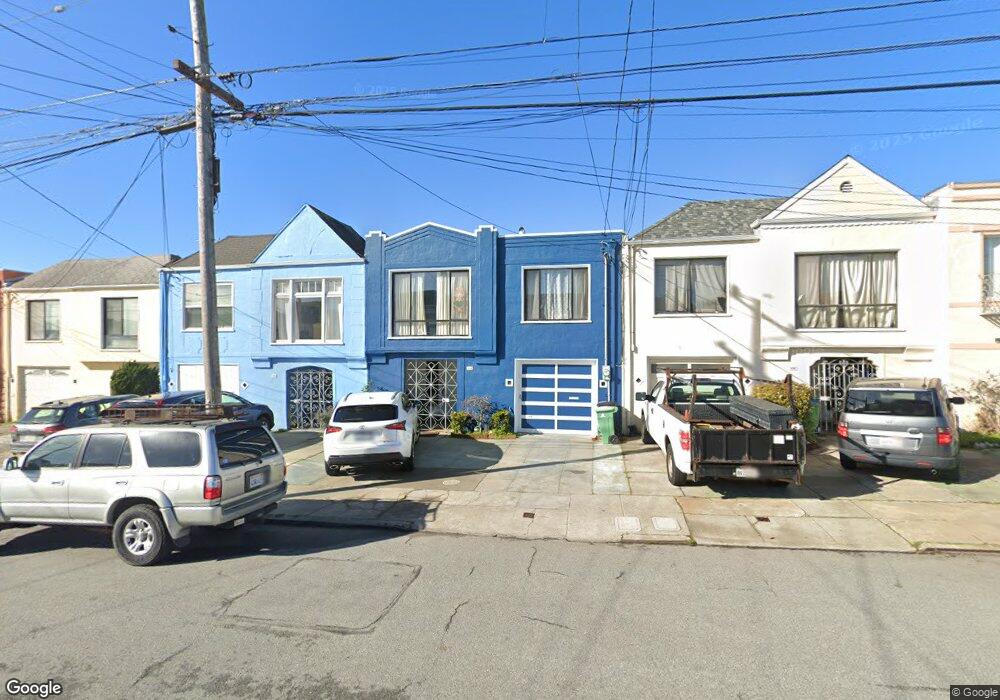
2323 43rd Ave San Francisco, CA 94116
Outer Parkside NeighborhoodEstimated Value: $1,040,000 - $1,452,000
3
Beds
1
Bath
950
Sq Ft
$1,332/Sq Ft
Est. Value
About This Home
This home is located at 2323 43rd Ave, San Francisco, CA 94116 and is currently estimated at $1,265,633, approximately $1,332 per square foot. 2323 43rd Ave is a home located in San Francisco County with nearby schools including Ulloa Elementary School, Hoover (Herbert) Middle School, and St. Gabriel School.
Ownership History
Date
Name
Owned For
Owner Type
Purchase Details
Closed on
Jun 23, 2023
Sold by
Efendi-Sullivan Susan and Efendi-Sullivan Cory Michael
Bought by
Efendi-Sullivan Susan and Khong Elise
Current Estimated Value
Home Financials for this Owner
Home Financials are based on the most recent Mortgage that was taken out on this home.
Original Mortgage
$150,000
Outstanding Balance
$144,060
Interest Rate
6.39%
Mortgage Type
Credit Line Revolving
Estimated Equity
$1,121,573
Purchase Details
Closed on
Mar 18, 2017
Sold by
Efendi Sullivan Susan and Sullivan Cory Michael
Bought by
Efendi Sullivan Susan and Khong Elise
Home Financials for this Owner
Home Financials are based on the most recent Mortgage that was taken out on this home.
Original Mortgage
$464,700
Interest Rate
4.3%
Mortgage Type
New Conventional
Purchase Details
Closed on
Mar 5, 2004
Sold by
Efendi Susan and Effendy Fredy
Bought by
Efendi Susan and Effendy Fredy
Home Financials for this Owner
Home Financials are based on the most recent Mortgage that was taken out on this home.
Original Mortgage
$458,000
Interest Rate
5.25%
Mortgage Type
Purchase Money Mortgage
Purchase Details
Closed on
Jan 7, 2002
Sold by
Efendi Budjang
Bought by
Khong Elise
Home Financials for this Owner
Home Financials are based on the most recent Mortgage that was taken out on this home.
Original Mortgage
$357,000
Interest Rate
6.84%
Purchase Details
Closed on
Dec 14, 2001
Sold by
Khong Elise
Bought by
Efendi Susan and Effendy Fredy
Home Financials for this Owner
Home Financials are based on the most recent Mortgage that was taken out on this home.
Original Mortgage
$357,000
Interest Rate
6.84%
Purchase Details
Closed on
Sep 28, 2001
Sold by
Efendi Budjang
Bought by
Khong Elsie
Home Financials for this Owner
Home Financials are based on the most recent Mortgage that was taken out on this home.
Original Mortgage
$357,000
Interest Rate
6.91%
Purchase Details
Closed on
Jan 11, 2000
Sold by
Lam Yee S and Lam Bonita W
Bought by
Khong Elisa
Home Financials for this Owner
Home Financials are based on the most recent Mortgage that was taken out on this home.
Original Mortgage
$301,500
Interest Rate
7.84%
Purchase Details
Closed on
Nov 29, 1999
Sold by
Efendi Bujang
Bought by
Khong Elise
Home Financials for this Owner
Home Financials are based on the most recent Mortgage that was taken out on this home.
Original Mortgage
$301,500
Interest Rate
7.84%
Create a Home Valuation Report for This Property
The Home Valuation Report is an in-depth analysis detailing your home's value as well as a comparison with similar homes in the area
Home Values in the Area
Average Home Value in this Area
Purchase History
| Date | Buyer | Sale Price | Title Company |
|---|---|---|---|
| Efendi-Sullivan Susan | -- | Chicago Title | |
| Efendi Sullivan Susan | -- | Wfg Lender Services | |
| Efendi Susan | -- | Fidelity National Title Co | |
| Khong Elise | -- | Old Republic Title Company | |
| Efendi Susan | -- | Old Republic Title Company | |
| Khong Elsie | -- | Old Republic Title Company | |
| Khong Elisa | $335,000 | Fidelity National Title Co | |
| Khong Elise | -- | Fidelity National Title Co |
Source: Public Records
Mortgage History
| Date | Status | Borrower | Loan Amount |
|---|---|---|---|
| Open | Efendi-Sullivan Susan | $150,000 | |
| Previous Owner | Efendi Sullivan Susan | $464,700 | |
| Previous Owner | Efendi Susan | $458,000 | |
| Previous Owner | Efendi Susan | $357,000 | |
| Previous Owner | Khong Elsie | $357,000 | |
| Previous Owner | Khong Elisa | $301,500 | |
| Previous Owner | Khong Elise | $40,000 |
Source: Public Records
Tax History Compared to Growth
Tax History
| Year | Tax Paid | Tax Assessment Tax Assessment Total Assessment is a certain percentage of the fair market value that is determined by local assessors to be the total taxable value of land and additions on the property. | Land | Improvement |
|---|---|---|---|---|
| 2025 | $6,702 | $514,834 | $308,906 | $205,928 |
| 2024 | $6,702 | $504,742 | $302,850 | $201,892 |
| 2023 | $5,939 | $494,846 | $296,912 | $197,934 |
| 2022 | $5,834 | $485,146 | $291,092 | $194,054 |
| 2021 | $5,735 | $475,636 | $285,386 | $190,250 |
| 2020 | $5,803 | $470,760 | $282,460 | $188,300 |
| 2019 | $6,217 | $461,530 | $276,922 | $184,608 |
| 2018 | $6,006 | $452,484 | $271,494 | $180,990 |
| 2017 | $5,637 | $443,541 | $266,130 | $177,411 |
| 2016 | $5,520 | $434,847 | $260,913 | $173,934 |
| 2015 | $5,448 | $428,319 | $256,995 | $171,324 |
| 2014 | $5,305 | $419,931 | $251,961 | $167,970 |
Source: Public Records
Map
Nearby Homes
- 2326 46th Ave
- 2470 43rd Ave
- 2262 47th Ave
- 2170 43rd Ave
- 3622 Rivera St
- 2142 43rd Ave
- 2278 39th Ave
- 3400 Vicente St
- 2591 39th Ave
- 2687 45th Ave
- 3535 Wawona St Unit 431
- 2275 35th Ave
- 2026 Great Hwy
- 1862 40th Ave
- 2225 Vicente St Unit 1
- 2225 Vicente St
- 2306 32nd Ave
- 2139 Taraval St
- 3917 Noriega St
- 1970 35th Ave