
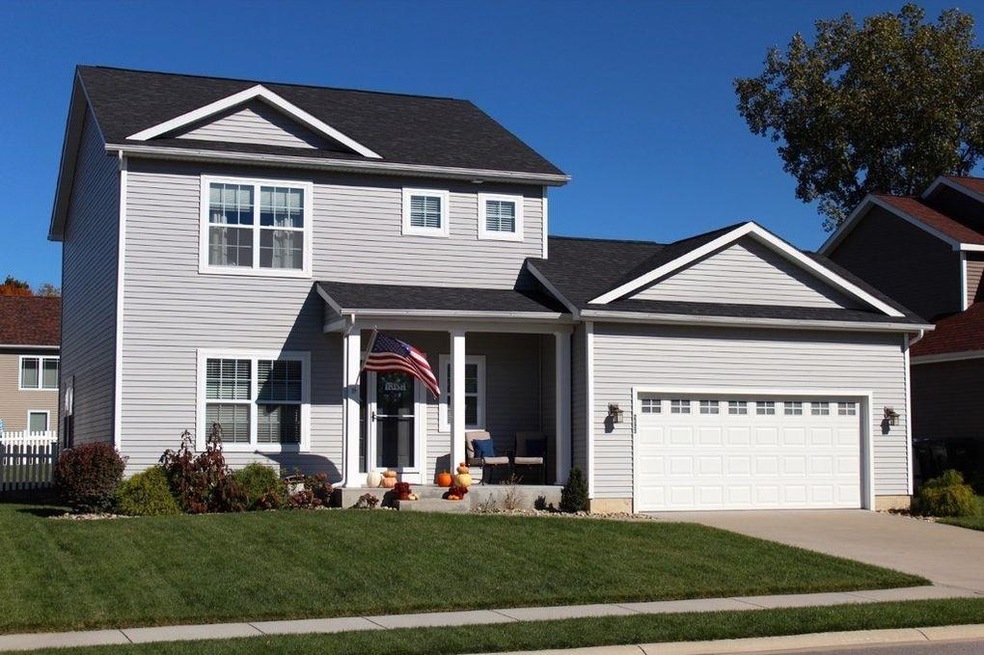
2323 Basin St South Bend, IN 46614
3
Beds
2.5
Baths
1,840
Sq Ft
8,276
Sq Ft Lot
Highlights
- 2 Car Attached Garage
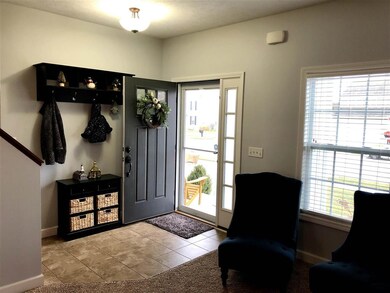
- Tile Flooring
- Level Lot
- Meadow's Edge Elementary School Rated A-
- Forced Air Heating and Cooling System
About This Home
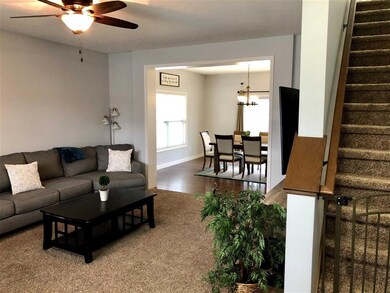
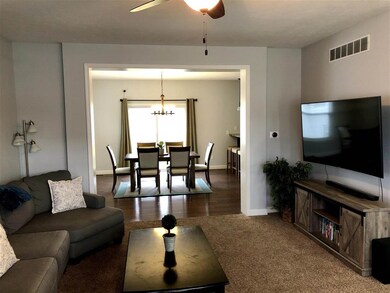
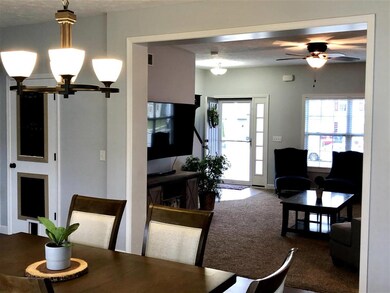
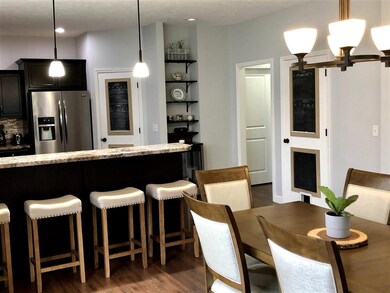
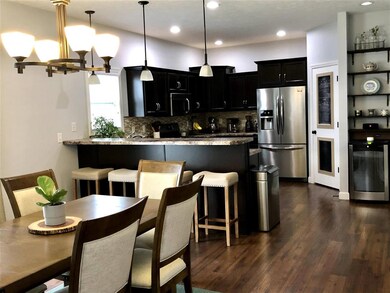
As of January 2021Rare find in a great neighborhood; move in ready, three bedroom, two and half baths, in Penn Schools! Sellers hate to leave this great place to live but are relocating for new jobs. You'll love the flow of the main level with the living area, dining, and kitchen leading to your outdoor entertaining space. The 9 foot ceilings throughout the main level add to the spacious feel. The main level also features your laundry room and a half bath. Upstairs, you'll find the master bedroom with ensuite, in addition to two spacious bedrooms and another full bath. Fresh paint throughout. The insulated basement is a blank slate for you to finish to suit your needs and includes roughed in plumbing for another potential restroom to help you get started. Also included is a lawn irrigation system and a good size shed for additional storage. South Bend City water/sewer. Enjoy your huge back patio in the fenced in backyard or a quiet evening walk around the neighborhood. Schedule today!
Home Details
Home Type
- Single Family
Est. Annual Taxes
- $1,965
Year Built
- Built in 2013
Lot Details
- 8,276 Sq Ft Lot
- Lot Dimensions are 63x159
- Vinyl Fence
- Level Lot
HOA Fees
- $8 Monthly HOA Fees
Parking
- 2 Car Attached Garage
Home Design
- Planned Development
- Poured Concrete
- Shingle Roof
- Vinyl Construction Material
Interior Spaces
- 2-Story Property
- Unfinished Basement
Flooring
- Carpet
- Laminate
- Tile
Bedrooms and Bathrooms
- 3 Bedrooms
Schools
- Meadows Edge Elementary School
- Grissom Middle School
- Penn High School
Utilities
- Forced Air Heating and Cooling System
Listing and Financial Details
- Assessor Parcel Number 71-09-32-126-096.000-033
Ownership History
Date
Name
Owned For
Owner Type
Purchase Details
Closed on
Aug 22, 2024
Sold by
Ingole Derek Lee and Ingole Vanessa Renee
Bought by
Ingole Ryan J and Ingole Kylie Jo
Current Estimated Value
Home Financials for this Owner
Home Financials are based on the most recent Mortgage that was taken out on this home.
Original Mortgage
$260,616
Outstanding Balance
$259,025
Interest Rate
6.77%
Mortgage Type
New Conventional
Estimated Equity
$111,104
Purchase Details
Listed on
Nov 29, 2020
Closed on
Jan 8, 2021
Sold by
Miller Adam and Miller Genevieve
Bought by
Ingole Derek Lee and Ingole Vanessa Renee
Seller's Agent
Bryan Hunter
Brick Built Real Estate
Buyer's Agent
Emeric Szalay
COLLINS and CO. REALTORS - LAKEVILLE
List Price
$275,000
Sold Price
$274,000
Premium/Discount to List
-$1,000
-0.36%
Home Financials for this Owner
Home Financials are based on the most recent Mortgage that was taken out on this home.
Avg. Annual Appreciation
6.99%
Original Mortgage
$283,864
Interest Rate
2.71%
Mortgage Type
VA
Purchase Details
Listed on
Feb 7, 2019
Closed on
May 6, 2019
Sold by
Charles White Dustin and Lynn Larissa
Bought by
Miller Adam and Miller Genevieve
Seller's Agent
Joseph Tiffany
Tiffany Group Real Estate Advisors LLC
Buyer's Agent
Bryan Hunter
Brick Built Real Estate
List Price
$259,900
Sold Price
$247,000
Premium/Discount to List
-$12,900
-4.96%
Home Financials for this Owner
Home Financials are based on the most recent Mortgage that was taken out on this home.
Avg. Annual Appreciation
6.41%
Original Mortgage
$234,650
Interest Rate
4.2%
Mortgage Type
New Conventional
Purchase Details
Listed on
Feb 7, 2019
Closed on
Apr 30, 2019
Sold by
White Dustin Charles and White Larissa Lynn
Bought by
Miller Adam and Miller Genevieve
Seller's Agent
Joseph Tiffany
Tiffany Group Real Estate Advisors LLC
Buyer's Agent
Bryan Hunter
Brick Built Real Estate
List Price
$259,900
Sold Price
$247,000
Premium/Discount to List
-$12,900
-4.96%
Home Financials for this Owner
Home Financials are based on the most recent Mortgage that was taken out on this home.
Original Mortgage
$234,650
Interest Rate
4.2%
Mortgage Type
New Conventional
Purchase Details
Listed on
Apr 28, 2017
Closed on
Aug 9, 2017
Sold by
Hiipakka Ryan and Hiipakka Cheryl
Bought by
White Dustin Charles and White Larissa Lynn
Seller's Agent
Jim McKinnies
McKinnies Realty, LLC
Buyer's Agent
Joseph Tiffany
Tiffany Group Real Estate Advisors LLC
List Price
$224,900
Sold Price
$226,500
Premium/Discount to List
$1,600
0.71%
Home Financials for this Owner
Home Financials are based on the most recent Mortgage that was taken out on this home.
Avg. Annual Appreciation
5.08%
Original Mortgage
$222,397
Interest Rate
4.03%
Mortgage Type
New Conventional
Purchase Details
Listed on
Oct 8, 2013
Closed on
May 30, 2014
Sold by
Oakbrook Homes Inc
Bought by
Hiipakka Ryan and Hiipakka Cheryl
Seller's Agent
Tim Murray
Coldwell Banker Real Estate Group
Buyer's Agent
Jim McKinnies
McKinnies Realty, LLC
List Price
$209,900
Sold Price
$188,000
Premium/Discount to List
-$21,900
-10.43%
Home Financials for this Owner
Home Financials are based on the most recent Mortgage that was taken out on this home.
Avg. Annual Appreciation
5.99%
Original Mortgage
$178,762
Interest Rate
4.34%
Mortgage Type
New Conventional
Purchase Details
Closed on
Sep 4, 2013
Sold by
Tampico Devlopments Llc
Bought by
Oakbrook Homes Inc
Similar Homes in South Bend, IN
Create a Home Valuation Report for This Property
The Home Valuation Report is an in-depth analysis detailing your home's value as well as a comparison with similar homes in the area
Home Values in the Area
Average Home Value in this Area
Purchase History
| Date | Type | Sale Price | Title Company |
|---|---|---|---|
| Warranty Deed | -- | Metropolitan Title | |
| Warranty Deed | $315,000 | Metropolitan Title | |
| Warranty Deed | $548,000 | Metropolitan Title | |
| Warranty Deed | $312,084 | None Listed On Document | |
| Warranty Deed | -- | None Available | |
| Deed | -- | Metropolitan Title | |
| Warranty Deed | -- | Fidelity National Title | |
| Warranty Deed | -- | Metropolitan Title |
Source: Public Records
Mortgage History
| Date | Status | Loan Amount | Loan Type |
|---|---|---|---|
| Open | $260,616 | New Conventional | |
| Closed | $260,616 | New Conventional | |
| Previous Owner | $283,864 | VA | |
| Previous Owner | $234,650 | New Conventional | |
| Previous Owner | $234,650 | New Conventional | |
| Previous Owner | $223,865 | FHA | |
| Previous Owner | $223,865 | FHA | |
| Previous Owner | $222,397 | New Conventional | |
| Previous Owner | $204,534 | VA | |
| Previous Owner | $178,762 | New Conventional |
Source: Public Records
Property History
| Date | Event | Price | Change | Sq Ft Price |
|---|---|---|---|---|
| 01/08/2021 01/08/21 | Sold | $274,000 | -0.4% | $149 / Sq Ft |
| 12/01/2020 12/01/20 | Pending | -- | -- | -- |
| 11/29/2020 11/29/20 | For Sale | $275,000 | +11.3% | $149 / Sq Ft |
| 05/10/2019 05/10/19 | Sold | $247,000 | -1.2% | $134 / Sq Ft |
| 03/21/2019 03/21/19 | Pending | -- | -- | -- |
| 03/03/2019 03/03/19 | Price Changed | $249,900 | -1.2% | $136 / Sq Ft |
| 02/26/2019 02/26/19 | Price Changed | $252,900 | -2.7% | $137 / Sq Ft |
| 02/07/2019 02/07/19 | For Sale | $259,900 | +14.7% | $141 / Sq Ft |
| 08/09/2017 08/09/17 | Sold | $226,500 | +0.7% | $123 / Sq Ft |
| 07/11/2017 07/11/17 | Pending | -- | -- | -- |
| 04/28/2017 04/28/17 | For Sale | $224,900 | +19.6% | $122 / Sq Ft |
| 05/30/2014 05/30/14 | Sold | $188,000 | -10.4% | $100 / Sq Ft |
| 04/23/2014 04/23/14 | Pending | -- | -- | -- |
| 10/08/2013 10/08/13 | For Sale | $209,900 | -- | $112 / Sq Ft |
Source: Indiana Regional MLS
Tax History Compared to Growth
Tax History
| Year | Tax Paid | Tax Assessment Tax Assessment Total Assessment is a certain percentage of the fair market value that is determined by local assessors to be the total taxable value of land and additions on the property. | Land | Improvement |
|---|---|---|---|---|
| 2024 | $2,892 | $275,400 | $63,300 | $212,100 |
| 2023 | $2,844 | $280,400 | $63,300 | $217,100 |
| 2022 | $2,856 | $282,800 | $63,300 | $219,500 |
| 2021 | $2,253 | $222,400 | $19,600 | $202,800 |
| 2020 | $2,126 | $209,600 | $18,500 | $191,100 |
| 2019 | $2,013 | $196,500 | $17,500 | $179,000 |
| 2018 | $502 | $175,400 | $16,600 | $158,800 |
| 2017 | $289 | $172,800 | $16,600 | $156,200 |
| 2016 | $292 | $172,800 | $16,600 | $156,200 |
| 2014 | $1,761 | $150,000 | $14,400 | $135,600 |
| 2013 | $7 | $300 | $300 | $0 |
Source: Public Records
Agents Affiliated with this Home
-
Bryan Hunter
Seller's Agent in 2021
Bryan Hunter
Brick Built Real Estate
(574) 361-9994
11 Total Sales
-
Emeric Szalay
Buyer's Agent in 2021
Emeric Szalay
COLLINS and CO. REALTORS - LAKEVILLE
(574) 298-4000
172 Total Sales
-
Carmen Ramirez Montenegro
Buyer Co-Listing Agent in 2021
Carmen Ramirez Montenegro
St. Joseph Realty Group
(574) 520-2560
145 Total Sales
-
Joseph Tiffany
Seller's Agent in 2019
Joseph Tiffany
Tiffany Group Real Estate Advisors LLC
(574) 252-4111
31 Total Sales
-
Allison Ledee
Seller Co-Listing Agent in 2019
Allison Ledee
Tiffany Group Real Estate Advisors LLC
(574) 400-5934
29 Total Sales
-
Jim McKinnies
Seller's Agent in 2017
Jim McKinnies
McKinnies Realty, LLC
(574) 229-8808
640 Total Sales
Map
Source: Indiana Regional MLS
MLS Number: 202047350
APN: 71-09-32-126-096.000-033
Disclaimer: Certain information contained herein is derived from information provided by parties other than Homes.com. All information provided is deemed reliable, but is not guaranteed to be accurate and should be independently verified.
![]() IDX information is provided exclusively for personal, non-commercial use, and may not be used for any purpose other than to identify prospective properties consumers may be interested in purchasing. Information is deemed reliable but not guaranteed.
IDX information is provided exclusively for personal, non-commercial use, and may not be used for any purpose other than to identify prospective properties consumers may be interested in purchasing. Information is deemed reliable but not guaranteed.
Nearby Homes
- 17813 Bromley Chase
- 5228 Essington St
- 2342 Chesire Dr
- 60526 Woodstock Dr
- 17746 Hartman St
- 1918 E Farnsworth Dr
- 1946 Renfrew Dr
- 5843 Durham Ct
- 1914 Stonehedge Ln
- 5709 Bayswater Place
- 5717 Bayswater Place
- 1983 Greenock St
- 1906 Somersworth Dr
- 4829 Kintyre Dr
- 4817 Huntley Ct
- 4919 York Rd
- 1424 Berkshire Dr
- 1402 E Jackson Rd
- 4909 Selkirk Dr
- 1402 Hampshire Dr